The PBS pie

Using a pie analogy for Australia Federal Government spend on the Pharmaceutical and Repatriation Benefits Schemes in 2017-18, the impact of rebates is clear with approximately $1 in 5 paid out as benefits for medicines, ultimately returning to Treasury.

The total $2.36 billion in rebates was repaid wholly by innovator manufacturers on the basis of Deeds of Agreement with the Commonwealth. Such arrangements are necessary to enable PBS listing with a published price that globally protects the return of investment for capital risked while a new product is still in patent.

The size of the proportion is an indication of the negotiating power of the Department of Health on behalf of Australian taxpayers following a positive PBAC recommendation. It could also be considered a measure of why Australia is perceived as a ‘free rider’ in terms of investment in development. It may be a reflection of a distorted Health Technology Assessment process, with policies such as lowest cost comparator that often bear no semblance to clinical practice.

Graph Source: PBS expenditure prescription report, 2017-18. Image source.

PBS structural change

The long-term impact of 2007 PBS reforms are clearly evident when comparing patient categories by proportion of services and benefits. The introduction of separate formularies for single (F1) and multiple brand (F2) drugs plus successive price disclosure initiatives have fundamentally altered the structure of the Australian Pharmaceutical Benefits Scheme.

Despite ongoing increases in Concessional ordinary category (patient co-payment $6.50 in 2019) services (blue dashed line on graph), the cost paid/subsidised by Government (benefits, blue) has remained flat. Once a patient has paid $390 (60 items), the remaining services for the calendar year are provided free (Concessional Safety Net in green). Since the reforms the trend has been flat or downward, with recent significant drops most likely due to the $1 discount and other dampening policies on qualification.

While General category (co-payment $40.30 in 2019, shown in orange) services as a proportion of total has dropped away since the reforms, benefits paid by the Government for General patients (orange solid line) has almost doubled to account for 30% of total benefits in 2017-18. This is counter-intuitive as there are an increasing number of PBS items below co-payment and paid 100% out-of-pocket by patients. It is likely a consequence of the type and cost of medicines over the co-payment (refer earlier post PBS by therapeutic area showing increasing benefits paid for Oncology, Immunomodulators and Anti-infectives (Hep C) medicines).

The reducing service numbers in the General category (orange dashed) are influenced by the of loss of exclusivity on molecules with high prescription volumes and subsequent price disclosure. A similar dampening effect on the  Safety net qualification is also obvious over time.

Notes:

Patient category refers to a patient’s eligibility status at the time of supply of a PBS or RPBS pharmaceutical benefit. Concessions are available to Centrelink issued Pensioner Concession Card, Commonwealth Seniors Health Card and Health Care Card holders; as well as those with a Department of Veteran Affairs White, Gold, or Orange Card. General benefits apply if you do not have any of these cards. Further details are available on the PBS and DVA websites.

PBS Patient Category reports are available on the Government data.gov.au website as annual excel workbooks with month by month breakdown for the time period 1992 to 2016. Downloading directly from Medicare Statistics website is also possible for the period 1992 to current.

Image Source

PBS rewards innovation?

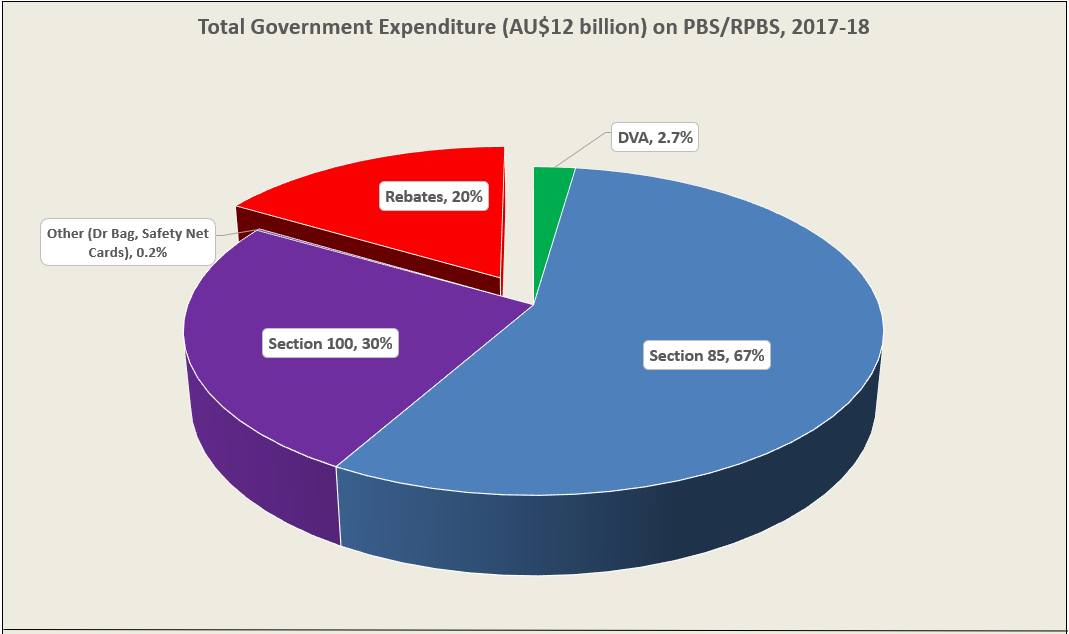
Last financial year (2017-18) the average benefit paid by the Australian Government per subsidised PBS/RPBS service was approximately AU $60 (1). However, separation of payments by therapeutic area (see graph) reveals a startling two-tier PBS with the majority of areas experiencing little growth in benefit paid since 1992-93, contrasted by those with consistent or dramatic spikes in growth.

How might this be interpreted?


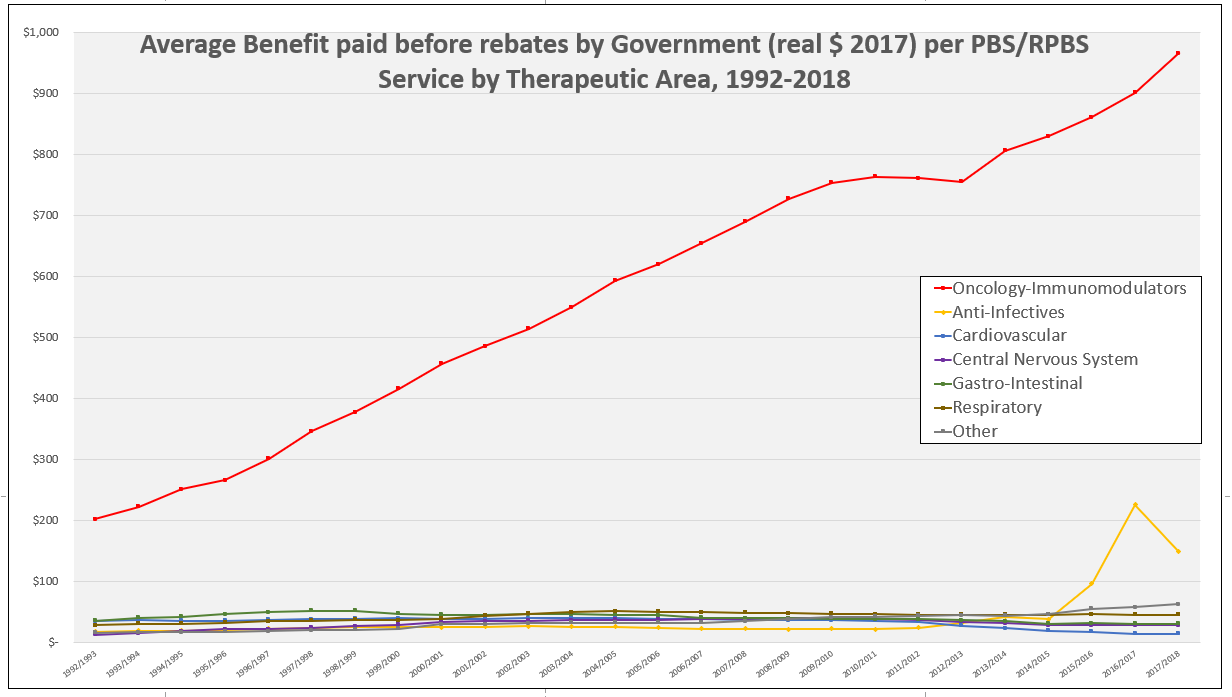
One possibility is that, based on published list prices, the PBS/RPBS is rewarding innovation. The steady climb in benefit paid per service for Oncology-Immunological agents reflecting the ongoing innovation in this sector, with the consistent introduction of new, more cost-effective therapies.

The average benefit paid in 1992-93 for these drugs was $202.24 per service (in real 2017 dollars) representing approximately 3% of total cost to Government. In 2017-18, this had risen to $966.48 per service and Oncology-Immunology accounted for 32% of total Government cost of the PBS, but only 2% of total services. Specialists and patients in other therapeutic areas could question how representative this is.

In 2016-17, anti-infectives accounted for over 25% of all benefits paid by Government coinciding with peak uptake of newly listed Hepatitis C treatments. Although given the magnitude of rebates required in this area, revealed by a now-withdrawn poster, this information should only be considered guidance to trends.

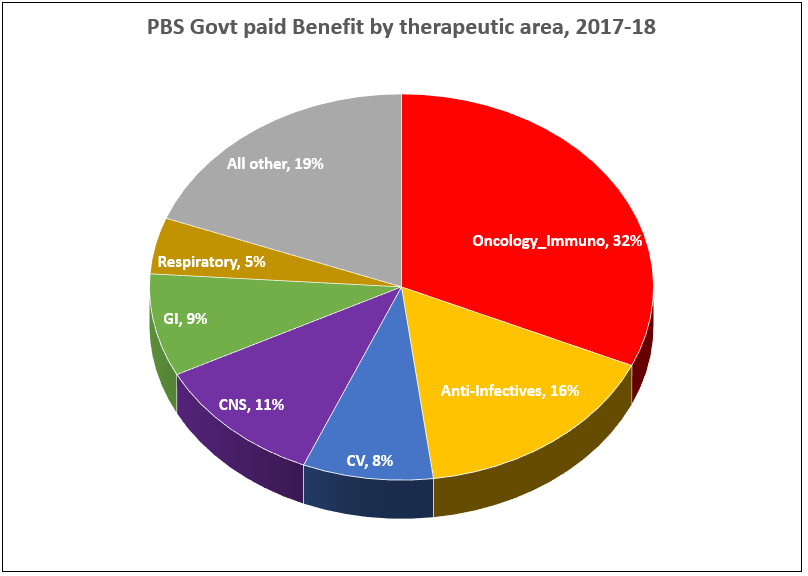
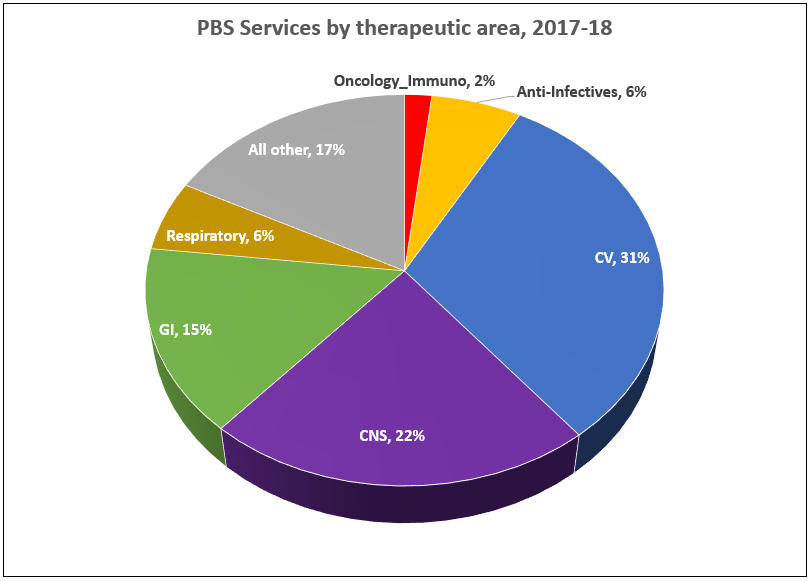
The impact of price disclosure on benefit paid is clearly illustrated by the Cardiovascular (CV) therapeutic area. Over the 26-year period graphed, services as a proportion of all PBS activity have increased from 22% to 31%. Meanwhile, in 1992-93 the average benefit paid by Government per service was $35.39, peaking at $40.99 in 2003-04, and dropping to $15.24 in 2017-18 where CV medicines account for only 8% of benefits paid.

In terms of proportions, CNS medicines have remained relatively stable over the time period: 18% in 1992-93 to 22% in 2017-18 of services; 10% and 11%, respectively for benefits.

Gastro-Intestinal medicines have experienced a similar trend with an increase in proportion of services from 11% to 15%, while the benefit dropped overtime from 16% to 9%. This is most likely a reflection of the continuing prescribing of PPIs, and their loss of patent exclusivity.

The Respiratory therapeutic area has experienced a decrease in both the proportion of services (10% to 6%) and benefit (12% to 5%). A look at raw numbers of services shows a slight increase from 11.4 to 12 million over the period.

Methodology:

PBS/RPBS data downloaded from the Medicare Australia Statistics website for the period 1992 through 2018 was analysed by therapeutic area. The Anatomical Therapeutic Chemical (ATC) classification system, as recommended by the World Health Organisation (WHO) for drug utilisation monitoring and research (WHO 2019 Guidelines), was used. Benefit and service data was collated separately and then used to calculate the average Government benefit paid ($) per service by therapeutic area. Adjusting the benefit to adjust for inflation into real 2017 dollars did not alter the trends.

References: (1) http://www.pbs.gov.au/info/statistics/expenditure-prescriptions/expenditure-prescriptions-twelve-months-to-30-june-2018

Image source: http://cancer.nautil.us/article/196/why-cancer-drug-prices-keep-rising-in-the- us

The size of the PBS in 2030?

Extrapolating historical cost data, total Government expenditure on the PBS in 2030 is predicted to range from AU$11.5 to $14.5 billion.

The linear model based on actual PBS/RPBS expenditure after rebates in real terms (2017 $) from 1992-93 to 2017-18 (first graph) predicts a 2029-30 total cost of $14,400 m. This approach does incorporate the impact of Government policy changes and fiscal constraints, as well as the listing of new medicines and adjustment for inflation. Hence, the number is plausible assuming more of the same.

The 2% annual growth rate predicted by the trendline aligns with the recent IQVIA Institute Report on Use of Medicine (2019) that forecasts between 2019 and 2023, medicine spending growth rates in countries similar to Australia, are expected to be within a 1-4% range year on year. However, the Budget 2018-19 program expense for Pharmaceutical benefits, services and supply suggest that over $14 billion should be considered a stretch upside. This is due to the magnitude of projections for 2020-21 ($9,864 m) and 2021-22 ($9,787 m) once changes to supply chain arrangements take effect.

To better reflect the current environment, using only the past 10-years data, the 2030 PBS size lands at $9.7 billion (R2=0.1, low validity); while a trendline based on the last 15 years, predicts a total PBS of approximately $11.5 billion for 2030 (R2=0.7).

If benefit growth rates (%) are used rather than actual spend on the program as the basis for extrapolation, using linear extrapolation results in increasing negative rates (to -6.8%) and a PBS of AU$6.3 billion in 2029-30! As this is nonsensical, a moving average over 3 periods has been used to construct a trendline (second graph) and this provides an estimate of total PBS size of $11,865 m in 2030.

Using projected growth from 2014-15 to 2027-28 in real pharmaceutical spending per person from the most recent Intergenerational report (2015), plus the assumption that 80% of the growth is expected to come from non-demographic factors, the 2027-28 PBS total figure can be expected to be around $ 10.5 billion, supporting that the 1992-2018 linear extrapolation may be an overestimate.

Assuming the future holds the same in terms of policy & innovation, the total PBS will cost Government < $13 billion in 2030. How much of that amount goes to which parts of the sector will depend on how effectively stakeholders make their individual cases.


Sources: Expenditure data available from 1992 on the Medicare Australia Statistics website, picture & PBS logo