A universal dental benefits scheme?

Dental health is an important component of personal well-being. Poor dental hygiene, apart from making unpleasant company, has been reported to be linked to higher rates of systemic disease. In an almost 40-year prospective cohort study of Swedish adults, Wilson and colleagues (2018) concluded that poor oral health is associated with a slightly increased risk of myocardial infarction. However, they caution that the results may partly be explained by residual confounding, in particular to tobacco smoking.

Closer to home, the Australian Dental Association’s Oral Health Tracker (February 2018) makes for sobering reading with 15.5% of adults reported as having inadequate dentition (< 21 teeth); 25.5% with untreated tooth decay and only 51% brushing twice daily with fluoridated toothpaste. This last figure is 68.5% in children aged 5-14 years but even so, 23.5% of this age group have already experienced decay in their permanent teeth.

The most recent AIHW report on oral and dental care in Australia notes that total expenditure on dental services (except those in hospitals) was $8.7 billion in 2012–13. This was an increase of approximately 46% (adjusted for inflation) over the decade from 2002-03. Assuming a similar growth rate, this figure may be, conservatively, around $11 billion in 2019-20.

Who pays for dental services?

In 2013, the largest source of funds for overall dental expenditure was individuals, paying directly out of pocket for 58% of total dental costs.


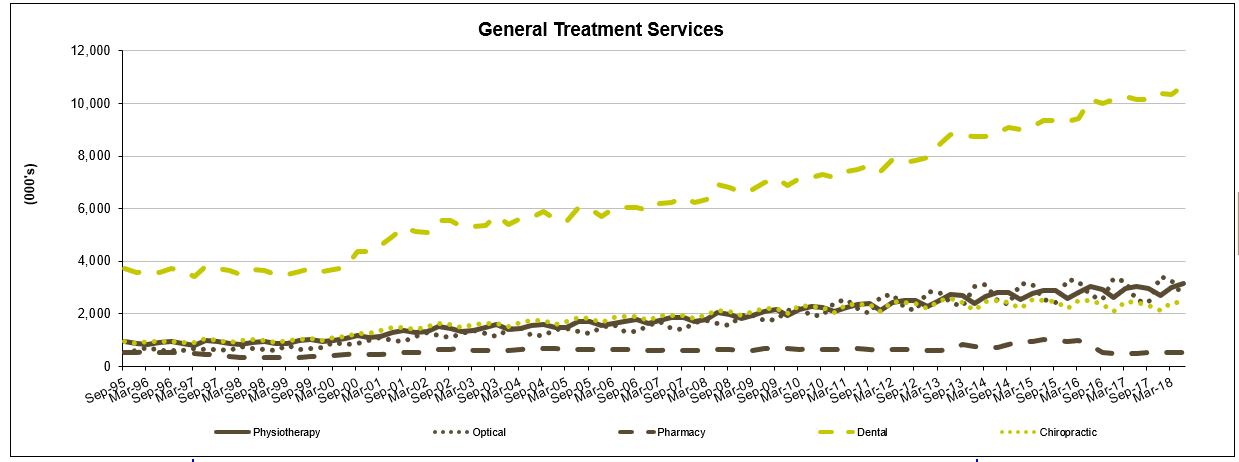
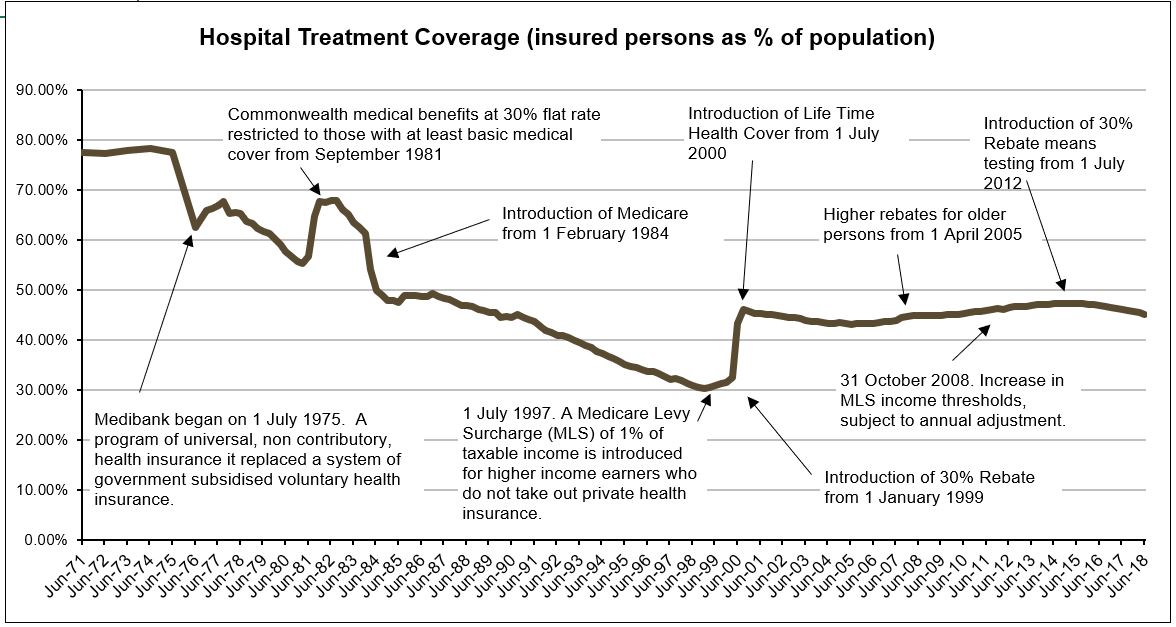
Of the 55% of Australians with dental coverage through their private health insurance, less than 10% of services were fully covered. The graph shows benefits paid for various extras services by private health insurers on a quarterly basis (APRA PHI Statistics). Dental services are clearly a pressure point and patient co-payments must be rising at a similar trajectory.

The Commonwealth Government can be said to contribute their part via the Private Health Insurance rebate (estimated to reach $6.5 billion by 2019-20). Additionally, a National Partnership Agreement on Dental services for Adults will provide approximately $316 million dollars to the States/Territories under the medical services sub-function for the same period. This infers that the States/Territories currently fund the bulk of public dental services.

A Child Dental Benefits Schedule (CDBS) was introduced by the Federal Government in 2014 for children aged between 2-17 years whose family receives Family Tax Benefit Part A or a relevant Australian Government payment. Interestingly, in the 2018-19 Budget, expenses for dental services are forecast to decrease by 7.0 per cent in real terms over the period 2018-19 to 2021-22, reflecting lower growth in utilisation of the CDBS. Potentially, this is a result of ongoing changes to the scheme, up to version 7.0 as at 1 January 2018.

The Australian healthcare system is acknowledged for its universality, structured around the 3 pillars of public hospitals, Medicare and the Pharmaceutical Benefits Scheme (PBS). A fourth, the National Disability Insurance Scheme (NDIS) is being established. By 2019-20, these will represent 4 of the top 8 program spends for the Commonwealth Government, budgeted at $22.3, $25.5, $11.7 and $20.7 billion, respectively.

In such an environment, the fact that 30% of Australians currently go without regular dental care due to cost, unavailability of services and other barriers, seems like a blind spot.  If dental health is a general indicator of personal health care practices, establishing good routines early in life may contribute to better overall population health. Isn’t that worth paying for?

The Final Report of the National Advisory Council on Dental Health (2012), established by the then Minister for Health and Ageing, the Hon Nicola Roxon MP and Senator Richard Di Natale, to answer this exact question, definitely thinks so. Dental policy options to achieve universal access are detailed and waiting…

Source: Cartoon, Donkey, from the Shrek movies.

Linking cancer screening & outcomes data

The Australian Institute of Health and Welfare (AIHW) has reported for the first time linkage and analysis of data by their Data Linkage Unit from the following six sources:

• BreastScreen Australia registers from the 8 states & territories;
• National Cervical Screening Program  registers from each state/territory;
• the National Bowel Cancer Screening Program Register;
• the Australian Cancer Database;
• the National Death Index; and
• the National HPV (human papillomavirus) Vaccination Program Register.

Privacy was protected as no one person had access to both the identified data and analysis variables. Data linkage was carried out in a step-wise fashion using identifying variables names, sex, date of birth and postcode. Probabilistic data linkage based on the method developed by Fellegi and Sunter (1969) was used.

Retrospective cohort studies were undertaken for breast, cervical and bowel cancer to assess survival for screen-detected compared with non-screen-detected cancers.

Breast cancers were identified on the Australian Cancer Database by ICD-10 code (C50) with date of diagnosis between 1 January 2002 and 31 December 2012 inclusive, for women aged 50–69 at diagnosis. These were linked with available data from BreastScreen registers (from 1 January 2000), and the screening history prior to each cancer used to assign a screening status to each breast cancer. These were: screen-detected cancers; non-screen-detected cancers in screened women;  interval cancers; non-screen-detected cancers in never-screened women. These individuals were then linked with data from the National Death Index to ascertain date of death and cause of death for those who had died by 31 December 2015.

Similar processes were undertaken for cervical and bowel cancers to create a National Screening Data Set. National identification numbers provided by the AIHW Data Linkage Unit to the AIHW Cancer and Screening Unit allowed the formation of a de-identified national cancer screening data set for analysis.

The Australian Cancer Database was linked to the National Screening Data Set using an outer join, meaning that all data from both data sets were retained in the final data set, which then comprised all screened individuals irrespective of whether they were diagnosed with a cancer, and all individuals diagnosed with a cancer irrespective of whether they were screened. This was important to ensure that breast, cervical and bowel cancers that were not detected through screening could contribute to the analyses, and that screening behaviour related to prior cancer diagnosis of any cancer type could be assessed.

Linkage with the National Death Index was the last step in the data linkage process. After linkage, there were 15,238,666 unique individuals in the project. The majority (61.7%) of individuals in the data linkage project had only one type of event (that is, appeared in only one of the data sources), while 24.6% experienced 2 event types, and 12.4% experienced 3 event types.

Three individuals experienced all 6 event types in the project, meaning that 3 individuals had a screening mammogram through BreastScreen, had a cervical cytology, histology or HPV test, were invited to the bowel screening program, were diagnosed with cancer, received at least 1 dose of HPV vaccine, and had died.

Breast cancer
There were 73,440 breast cancers diagnosed in the cohort selected for survival analyses (women aged 50–69 diagnosed 1 January 2002 to 31 December 2012). Women diagnosed with screen-detected breast cancers were less likely to die, and those who did die were less likely to die from breast cancer than women whose breast cancer was not screen-detected, with 50.5% of deaths in women with screen-detected breast cancer due to breast cancer, compared with 74.2% in never-screened women.

Cervical cancer 
There were 6,897 cervical cancers diagnosed in the cohort selected for survival analyses (women aged 20–69 diagnosed 1 January 2002 to 31 December 2012). Women diagnosed with screen-detected cervical cancers were less likely to die, and those who did die were less likely to die from cervical cancer than women whose cervical cancer was not screen-detected, with 67.7% of deaths in women with screen-detected cervical cancer due to cervical cancer, compared with 78.7% in never-screened women.

Never-screened women diagnosed with cervical cancer had the highest risk of cervical cancer mortality. The unadjusted hazard ratio for cervical cancer mortality for women diagnosed with cervical cancer was 0.11, i.e. 89% less chance of dying of cervical cancer than a never screened woman. All cause mortality was also statically significantly lower.

Bowel cancer 
There were 31,427 bowel cancers diagnosed in the cohort selected for survival analyses (people aged 50–69 diagnosed 1 August 2006 to 31 December 2012). Of the diagnosed bowel cancers, 3,316 (10.6%) were screen-detected. The relatively low proportion is due to the need to be invited to have a bowel cancer detected through the screening program (previously limited to those turning 50, 55 or 65). The proportion of bowel cancers that are screen-detected is expected to increase with the introduction of biennial screening for all Australians aged 50–74 from the year 2019 (see previous post). People diagnosed with screen-detected bowel cancers were less likely to die, and those who did die were less likely to die from bowel cancer than people whose bowel cancer was not screen-detected, with 65.8% of deaths in people diagnosed with a screen-detected bowel cancer due to bowel cancer, compared with 78.1% in people never-invited to screen.

Further publications from the project are to follow. This first report clearly shows the value of data linkage, and overwhelmingly, the public health benefit of both Government subsidised screening programs and of participating in them!

Private Health Insurance in Australia

The foundations of the modern Australian Healthcare System are three publicly-financed programmes:  Medicare, Pharmaceutical Benefits Scheme & Public Hospitals. However, private health services are an increasingly critical piece of the infrastructure, with approximately 40% of hospital admissions during 2016/17 occurring in the private system. Although not mandatory, such services can be funded through private health insurance (PHI).

The benefits of PHI include choice of doctor, assistance with the cost of treatment in a private hospital, and the cost of ancillary treatments not covered by Medicare such as dental, optical and physiotherapy. The median waiting time for elective surgery for privately insured patients has been reported to be approximately half that of public patients, at 20 and 42 days, respectively.

The PHI policies currently on offer contain a bewildering combination of benefits, co-payments, exclusions and restrictions depending upon the premium paid. Ambulance transport is usually covered, importantly as a trip may be free in some states/territories of Australia but only for ‘medically necessary’ journeys in others, or not at all.

A recent Choice review looked at free online insurance comparison websites purporting to assist consumers to select the most appropriate policy. They found that ‘free’ comparison sites may actually earn fees that make up a sizeable proportion of total premiums. Some sites only compared  part of the market, while others were owned by the insurance companies they were comparing!

Membership woes

In June 1974, around the time of introduction of universal healthcare, a peak of 78.4% of the Australian population held private hospital insurance cover. At the end of June 2018, this figure was 45.1%, with 54.3% holding ancillary/extras or general cover (ambulance at a minimum). The policy trials and tribulations of maintaining private hospital cover levels are clearly shown in the graph.

Source: APRA Quarterly PHI Statistics 

The 2011 National Health Reform Agreement allowed patients with private hospital insurance entering a public hospital to choose whether to be admitted as a public or private patient. This led to an increase in the proportion of public hospital activity funded through private health insurance. Data shows that while 1 in 12 admissions to a public hospital in 2006–07 were under PHI, this figure increased to 1 in 7 during 2015–16 (AIHW 2017) suggesting that public hospitals were encouraging patients to use their private cover. Subsequently, negatively impacting the cost of PHI premiums and public hospital waiting lists.

As policy holders uptake of medical services and the cost of treatments and procedures both rise, premium affordability is becoming an issue. The trend is away from PHI membership as premiums continue to increase year-on-year at twice the rate of  inflation in an environment of low wage growth. Younger members, who are less likely to claim, are dropping cover (refer graph) leading to the question being asked: how can PHI funds be sustainable and afford to pay (ageing) members’ claims into the future?

Further Policy Reform

In October 2017, the Government announced a significant reform package, aimed at addressing some of the issues described. Successful implementation and adoption of these reforms will be essential to maintain the existing levels of service provided by the healthcare system.


For more detail, see the Parliamentary Library’s ‘Private Health Insurance: a quick guide’ by Amanda Biggs, Social Policy Section (Research Paper Series, 2017–18, 4 August 2017)

Meme source: King Julian Madagascar

Under PBS co-payment data

The Fifth Community Pharmacy Agreement (5CPA) contained a clause requiring community pharmacies to provide data to the Commonwealth on each PBS prescription dispensed at a price below the general patient co-payment. This was $35.40 when collection began on 1 April 2012 following enactment of the National Health Amendment (PBS) Act 2010. Prior to this date, PBS prescription data was only collected when a Government subsidy applied, reflecting the original purpose of the system.

The collection of data on use of PBS medicines by the Australian population has become an important secondary function. The combined impact of an increasing general co-payment amount (linked to CPI) and decreasing manufacture prices (price disclosure once off patent, no CPI), mean that a high proportion of medicines listed on the PBS are now priced below the general patient co-payment.

Given that such medicines include many commonly prescribed antibiotics, as well as medicines and other items associated with management and treatment of chronic diseases, it is important to fill this information gap. The Department of Health engaged KPMG to conduct a Combined Thematic Review of Access, Consumer Experience and Quality Use of Medicines under the 5CPA. The March 2015 Final Report did find that the initiative supported this aim. The data is collected from public and private hospitals and 99% of community pharmacies. It provides a tool for health policy planning, research, pharmacovigilance, monitoring risk management protocols and quality use of medicines in the community. The additional data has also been used to improve the accuracy of information available to the Pharmaceutical Benefits Advisory Committee (PBAC), among other decision makers.


The number of under co-payment Section 85 prescriptions dispensed on the PBS from 2012-13 through to 2016-17 are shown in the graph. The volume is increasing, however of more interest is the under co-payment prescriptions as a proportion of total PBS S85 prescriptions dispensed shown by the orange line. This was 24% in 2012-13 and increased to over 30% in 4 years.

Almost one third of S85 PBS prescriptions dispensed in Australia during 2016-17 were under co-payment and paid for by patients (out-of-pocket). Clearly medicines are affordable or the PBS is not the universal scheme it is generally stated to be.

Other gaps continue to exist in medicine usage data, for example, for medicines down-scheduled off the PBS to over-the-counter availability.


Sources: PBS statistics and Expenditure reports (www.pbs.gov.au); The Simpsons.