The State of Play

At the time of federation in 1901, health was not a public policy topic. The new Australian Constitution granted the Commonwealth responsibility for quarantine, under s 51(ix) and for ‘invalid and old age pensions’ under s 51(xxiii). However, by 1945 the situation had changed, with health firmly on the political agenda. Consolidation of the welfare state principle in most democracies, galvanised by the suffering and sacrifice of WWII, created governments compelled to provide basic care for all their residents.

In 1946, the Constitution was amended granting the Commonwealth power to make laws with respect to health among others (1). Under s 51(xxiiiA), the Federal Government assumed power over social services, including ‘pharmaceutical, sickness and hospital benefits, medical and dental services (but not do as to authorize any form of civil conscription)’ (2). The various Acts that followed established the Australian health care system of today.

The states have power over hospitals and other services without the financial resources to fully fund those services, whilst the Commonwealth has funding capacity unmatched by the power to regulate the services it finances.’  Wheeler 1995

‘These divisions render coherent policy making, even at the state level, almost impossible.’ Duckett2004

The Commonwealth is financially the prevailing force, receiving over 80% of all tax revenues collected in Australia (State and local government taxes and levies accounted for the other).

Looking at New South Wales (NSW), in addition to the revenues it collects, the state receives grant revenue from the Commonwealth Government (including GST payments, National Agreements and National Partnerships) forecast to be around $32.5 billion in 2018-19, out of total state revenue of approximately $80 billion.

Health (28.6%, $22.9 billion) is the largest Recurrent Expenditure group for the NSW Government in 2018-19.  This is not the case with Capital Expenditure with transport representing 56.5%, and health a distant second at 12.5%. Those stadiums don’t rate costing only 2.2 billion!

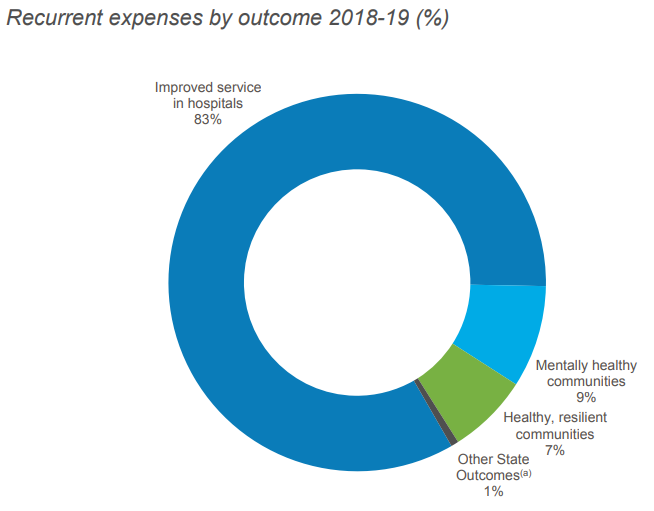
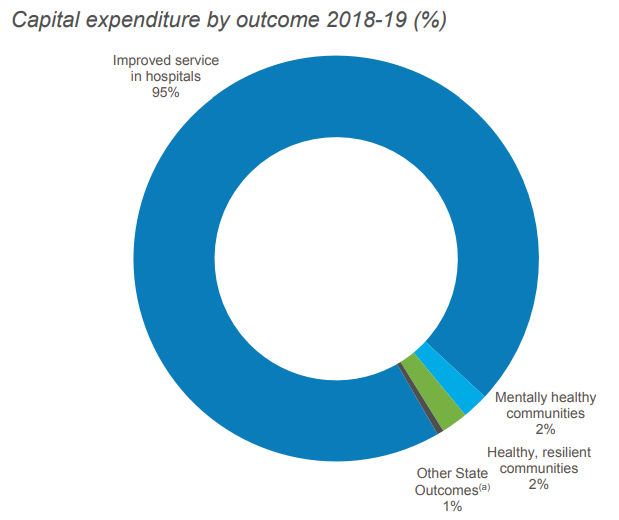
The charts below relate specifically to the NSW Health Budget showing the proportion of spend by anticipated outcomes. Hospitals predominate in both. In yesterday’s state election, the  incumbent’s campaign claimed to have invested nearly $10 billion in health infrastructure since coming to office in 2011, with another $8 billion committed over the next four years.

Notes:

(1) Other sources of Commonwealth power include: s 96 (the power to make special purpose grants); ‘insurance’ (s 51(xiv)), the corporations power (s 51(xx)); the defence power (s 51(vi)); and, as amended by the referendum of 1967, s 51(xxvi) which empowers the Commonwealth to make laws for the benefit of Indigenous Australians’. Griffith 2006

(2) This conscription statement is the origin of the differences between Federal Government payment systems for PBS and MBS.

References available on request.

Who is subsidising who?

Over 30% of all prescriptions written in Australia for PBS-listed medicines are self-funded as they cost less than the relevant Co-payment (under co-pay).

General patients (co-pay $40.30, 1 Jan 2019) are the sole recipients of this cost-shifting as the dispensing fee ($7.29) is greater than the Concessional co-pay amount ($6.50).

So why do the 8% of Services to General patients account for over 30% of Government PBS/RPBS expenditure?

The bar graph shows Benefit paid and differences in proportion of Services attributable to patient categories with and without inclusion of under co-payment numbers. Another way to present this, and as reported in the annual PBS expenditure & prescription tables, is as Average Government Benefit paid per Service.

The line graph shows the evolution of Average Benefit per Service by patient category over time. This graph is based on figures downloaded from Medicare Australia website (includes both Section 85 & Section 100). The total services (approximately 205 K) match the prescription numbers presented in the PBS Expenditure and Prescription Report for the same periods, which exclude under-co payment prescriptions (since reporting started in 2012-13).

Why is the Average Benefit per Service currently over five times higher for the General patient category compared to Concessional?


Is there a difference in the demographics of General and Concessional patients such that higher cost (F1) medicines are prescribed more frequently to General category patients?

Benefit paid per service ($) by ATC CV CNS Anti-Infectives GI Respiratory Oncology-Immuno Other
2017/2018 $ 15.24 $ 28.65 $ 149.68 $ 31.64 $ 46.16 $ 966.48 $ 62.98

In recent years, the peak and drop for average benefit paid per service for the General ordinary category mimics that of usage of new Hepatitis C treatments. Is there disproportionate prescribing of these and other higher cost drugs, such as oncologics and immunomodulators, between categories? To test this, benefit figures were downloaded from the Medicare Australia website for Hepatitis C medicines and reveal a split between General and Concessional patient categories of 39% to 61% in $1.37 billion paid by Government during 2017-18. Total service numbers (72,266) show a similar ratio with General 37% and Concessional 63%. For the ImmunOncology medicine, Nivolumab (Opdivo, BMS) total services (40,560) were split General 32% to Concessional 65% in 2017-18.

Perhaps the cause is an artefact of the huge volume, relative to General patients, of low cost (F2) items prescribed, and paid by Government for Concessional patients? Rosuvastatin and Atorvastatin had the highest prescription volumes in 2017-18, of these 37% and 30%, respectively were under co-payment prescriptions.

As a proportion of over co-payment prescriptions in 2017-18, Safety Net (SN) accounted for by 1.3% of the General patient category and 18.2% Concessional. The addition of approximately $40 and $6.50, respectively per script to Government expenditure is unlikely to be responsible for the large difference in average benefit per service paid, given the General SN category is so small.

Suggestions on what may be driving this difference are welcome. Hope you can provide me with a D’oh moment!


Sources: Simpsons; Medicare Australia Statistics; PBS expenditure prescriptions report tables

Three slices of the PBS

Like it or not, product and service providers to the PBS are in competition. 

The winners and losers during development and roll-out of the 2015 PBS Access and Sustainability Package (PASP) left no doubt about that. 

A collaborative approach within the sector, to increase the size of the currently diminishing pie, will be more sustainable and deliver better health outcomes.

(1) Manufacturers

Manufacturer revenues accounted for approximately 70% of total Government Expenditure on the PBS/RPBS in 2017-18. In terms of costs, around 40% goes to innovator companies with single brand medicines in formulary F1; 20% to suppliers of multi-branded medicines in F2; and the remaining 10% for Combination products. The overall split, volume-wise, of prescriptions by formulary was F1, 11%; F2, 85% (half under co-payment and not represented in chart below); and Other, including combinations, 4%.

(2) Wholesalers

Wholesalers are remunerated via the regulated mark-up on ex-manufacturer price, currently 7.52%. This is agreed as part of the 5-year Community Pharmacy Agreement (CPA) negotiated with the Government of the day by the Pharmacy Guild. In 2017-18, payments to wholesalers represented only 4% of total Government expenditure on the schemes.

In their 2016 Submission to the King Review of pharmacy remuneration and regulation, the National Pharmaceutical Services Association (NPSA) re-iterated their view that the funding provided to wholesalers under the 6CPA is inadequate and unsustainable. This is even without including the impact of direct distribution to pharmacy model selected by some manufacturers.

The Community Service Obligation (almost $ 200 million per year) divided between full service wholesalers is not captured in the pie chart. However, a minimal increase on the previous CSO amount and a loss of  indexation during negotiation of the 6CPA, raises the question is anyone representing wholesalers at the table with Government?

(3) Pharmacy

The 2015 PASP/6CPA introduction of a flat, but CPI indexed Administration Handling and Infrastructure (AHI) fee successfully uncoupled community pharmacy remuneration from the price of medicines, and added to the growing range of professional services being remunerated. In addition to existing fees for dispensing, electronic prescriptions and incentives, such as to provide premium free medicines.

This approach has, and is, largely protecting pharmacy from the ongoing financial squeeze being experienced by manufacturers and wholesalers due to price disclosure, successive reforms and Department of Health activity.

Many of the professional service payments and pharmacy revenue, such as $600 m for the new Dose Administration Aid program and Minister Hunt announcements at APP2019, are not captured in the 26% of Government expenditure on the PBS/RPBS shown in the chart. For example, Clause 3.5 of the 6CPA notes: ‘The Commonwealth also estimates that community pharmacy will receive up to a further $4.8 billion from dispensing pharmaceutical items that are priced below the Maximum CoPayment.’ (1)

Bruce Annabel noted in a recent AJP article that ‘on average, pharmacies are receiving circa $30,000 pa services income’ with some generating over $200,000 pa.

With the PSA recently announced to join the 7CPA negotiations, and SHPA at APP2019 also wanting to play a role, as hospital pharmacists oversee more than 20% of annual PBS expenditure, there are going to be some unfamiliar faces at the table, very likely facing a new Minister of Health.

Sources: Department of Health Expenditure & Prescriptions Report; PharmaDispatch; Google Images


(1) The 6CPA bottom line of $18.9 billion to be paid to pharmacy over the life of the agreement, also excludes remuneration when community pharmacies dispense medicines under Section 100 special arrangements and the $372 m compounding fees which will be paid directly to chemotherapy compounders, who may not be approved suppliers.