Co-dependent Technologies (Test + Drug)
Presented at ARCS Conference 2024
Presented at ARCS Conference 2024
https://tacshealthcare.com.au/wp-content/uploads/2023/11/NSW-CC-Sep-2023-Poster-186.pdf
Objective
As one of the three pillars of Australia’s universal public health system, the Pharmaceutical Benefits Scheme (PBS) provides equitable access to medicines for all Australians. Cancer is a leading cause of death of Australians (18% in 2020).1 Hence, timely availability of new treatments on the PBS has become more critical than ever.
This retrospective review of the listing and use of cancer pharmacotherapies on the PBS considers whether the current scheme is meeting the needs of Australian medical oncologists, haematologists and their patients.
Methods
PBS and Repatriation PBS (RPBS) claims data for all funded programs, including chemotherapy, were sourced from the Services Australia 2 and PBS3 websites. Services (prescription dispensed for a PBS item) for and benefit statistics were graphed by Anatomical Therapeutic Chemical (ATC) first level code over time. Proportions of Government expenditure and average cost per service were calculated.
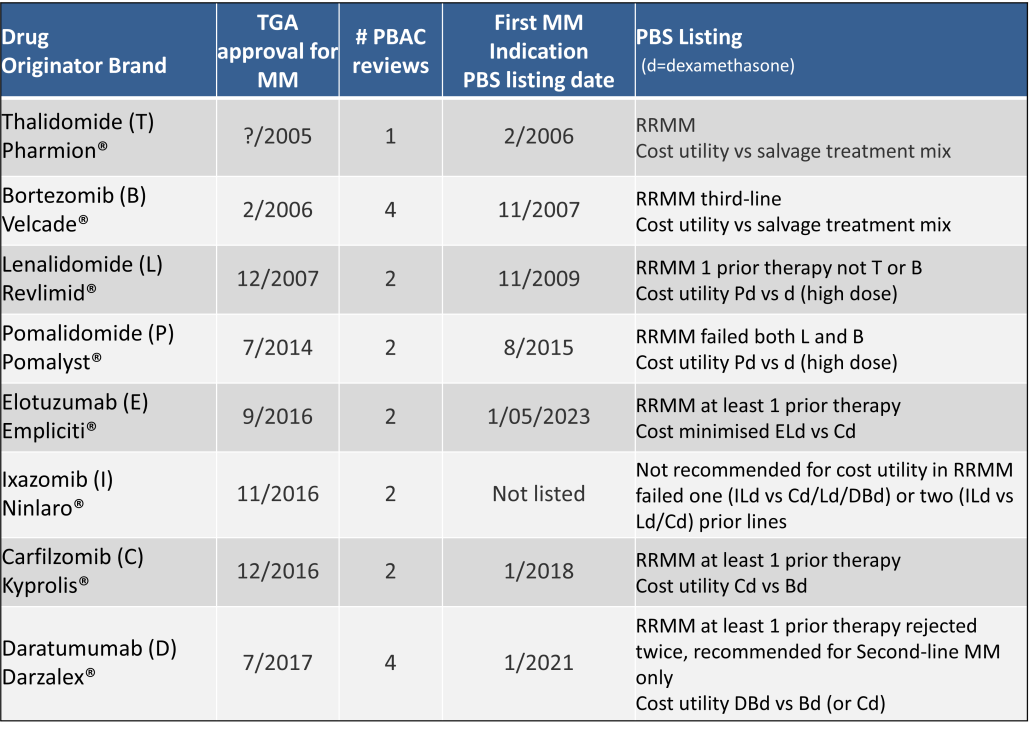
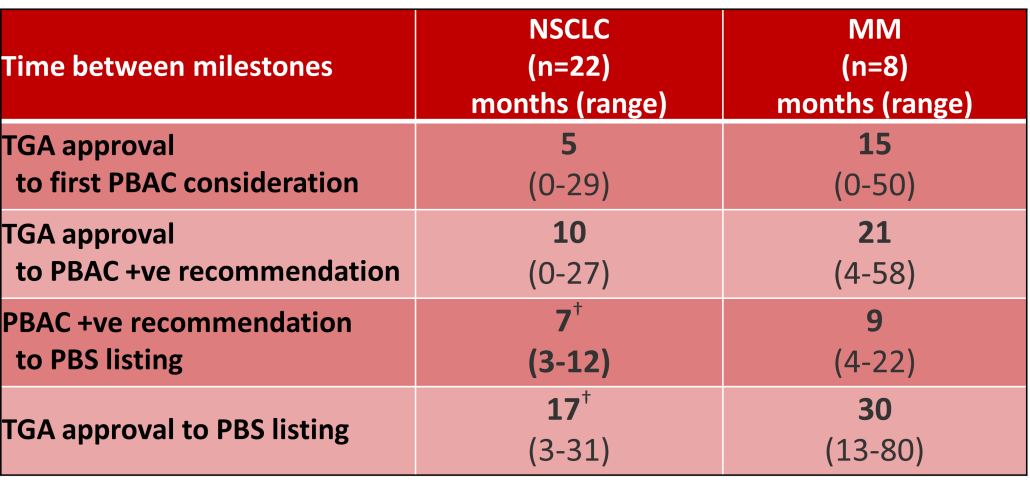
Outcomes of Pharmaceutical Benefits Advisory Committee (PBAC) Meetings4 were reviewed to identify considerations for the first indication of new products for non-small cell lung cancer (NSCLC) and Multiple Myeloma (MM), as representative of pharmacological treatments for solid tumour and haematology indications. The duration between marketing approval by the Therapeutic Goods Administration (TGA) and time points to PBS listing were determined.5
Results
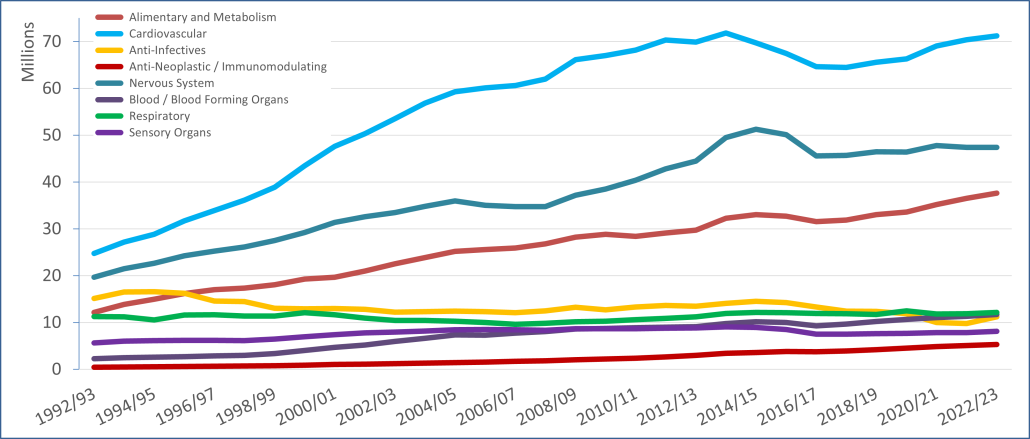
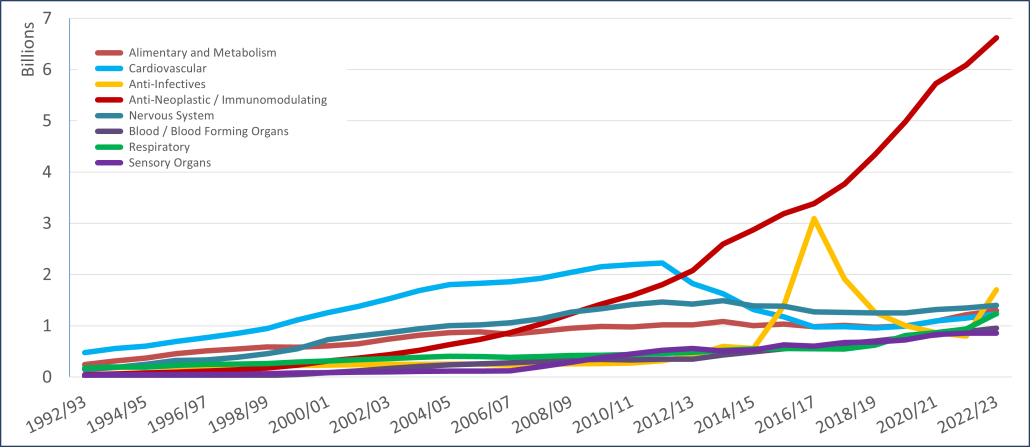
PBS/RPBS claims data was available by ATC for the 31-year period 1992/93 to 2022/23. Changes in the number of services provided and benefit paid by the Federal Government (excluding patient co-payments) for ATC groups contributing over 5% are shown in Figures 1 and 2. Table 1 provides cost breakdowns by ATC, including patient out of pocket contributions.
All ATC groups grew over time mirroring societal demographic changes. The higher growth of Cardiovascular, Nervous System and Alimentary groups reflect treatment innovations with statins, anti-depressants and proton-pump inhibitors, respectively.
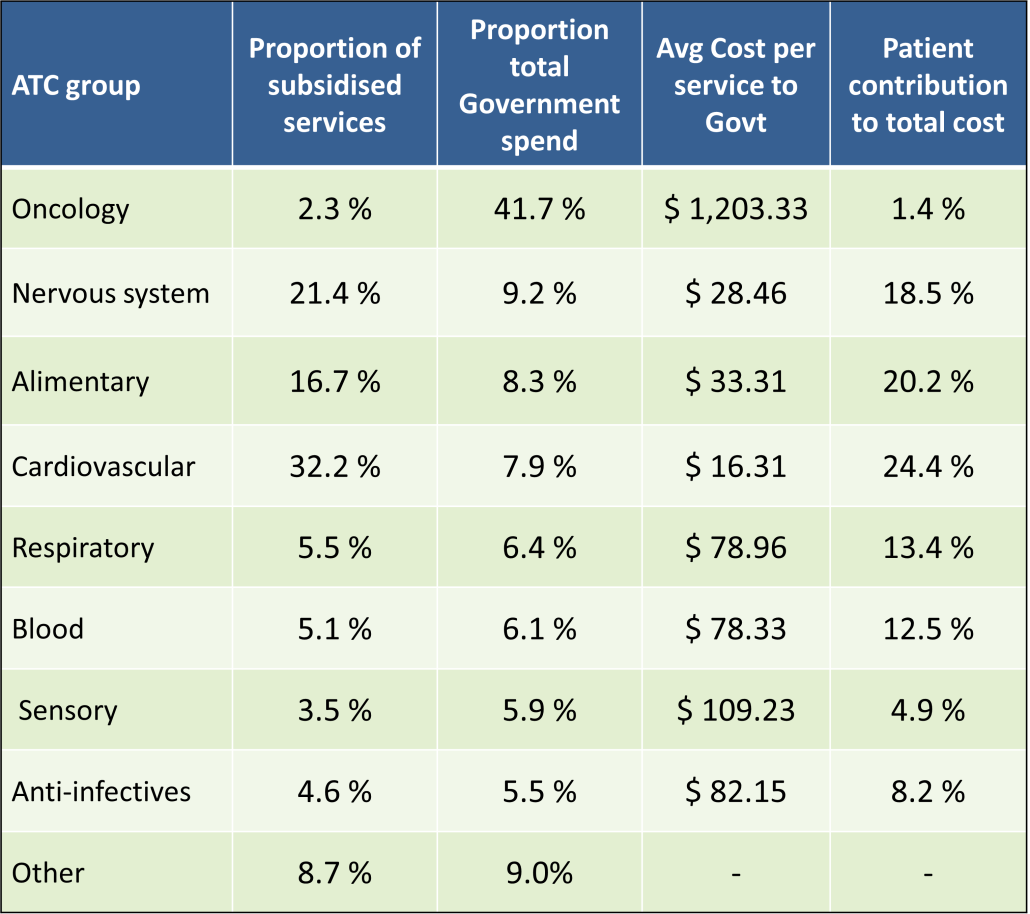
The introduction of Section 100 High-Cost Drugs to reimburse States for in-hospital usage of certain therapies, and agreements between the Commonwealth and all States/Territories, except NSW/ACT, to permit PBS out-patient dispensing have also added service volume to the scheme. Increased costs have been offset by pricing policy changes, mostly directed at manufacturers, such as splitting into Formularies by molecule patent status, Price Disclosure and Efficient Funding of Chemotherapies (EFC).
While the proportion of total services for cancer treatments grew over time, the ATC group represented only 2.3% of PBS/RPBS activity in 2021/22. However, in the same year, the group represented 41.5% of total Government expenditure on the PBS/RPBS program and continuing to grow.
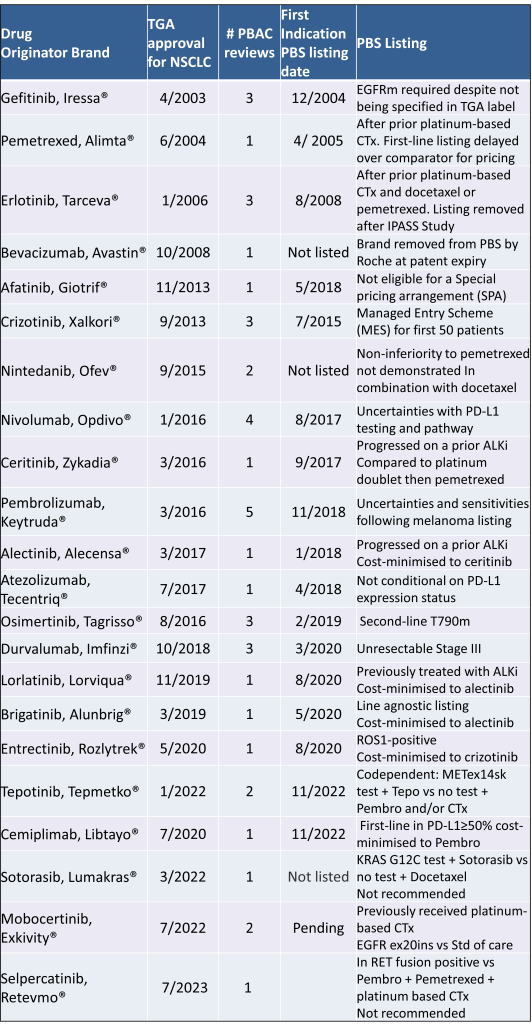
Table 2 lists new medicines requesting PBS listing for a NSCLC indication, and Table 3 for Multiple Myeloma from PBAC Meeting outcome documents available from December 1999. Public Summary Documents were introduced from July 2005. The number of PBAC considerations and date of TGA approval and PBS listing are noted.
Discussion
Innovative medicines are now considered by the PBAC at similar times to TGA approval due to policies such as Parallel Processing and TGA Provisional pathways. Streamlining of PBS processes in the past 5 years see clinically effective drugs navigating the process usually within two PBAC considerations. Beyond this, intractable issues can introduce a significant lag between local treatment practices and internationally accepted standards of care.
The finding that there was an average 13-month difference in time to access new treatments for MM and NSCLC on the PBS over the period supports ongoing policy reform to accelerate access.
Conclusions
•Although variable time to access, the PBS/RPBS is serving patients with cancer, and their clinicians by subsidising innovative treatments.
•Treatments for cancer account for an increasing proportion of total Government expenditure on the scheme. Currently, over 40% and growing.
•Although the proportion of patient out-of-pocket costs are comparatively low, the actual amount can be significant and inequitable relative to other therapeutic areas.
According to the Royal Pharmaceutical Society, medicines are responsible for ~25% of the UK NHS’s carbon emissions [1].
These emissions result from the manufacture, procurement, transportation, and use of medicines (20%), with the remaining 5% specifically from inhalers and anaesthetic gases [1].
On a global level, the health sector has been estimated to contribute approximately 4.4% of global net emissions by the Health Care Without Harm organization [2].
While simple changes such as opting to use propofol instead of desflurane as an anaesthetic reduces the total amount of greenhouse gases released over the drug life cycle [3], what consideration is given to the environmental impact of new medicines when being evaluated for pricing, reimbursement and access at launch?
With climate change happening at an ever-increasing rate, it’s no surprise that the topic of sustainability and environmental impact was raised in several forums at the recent HTAi Annual Meeting in Australia, as noted by one of our FingerPost consultants, Sharon Leadbitter, who was in attendance.
Is environmental impact a relevant dimension to include in HTA?
From our experience at FingerPost, the environmental impact is not a consideration for access, pricing and reimbursement decisions. Because of this, it is ignored in the value messaging, objection handling, economic modelling and HTA submissions for new medicines.
Payers do consider wastage and storage in relation to formulary listing decisions, but this is typically from a practicality and budget perspective, rather than an environmental one. But could this change in the future as sustainable prescribing policies are scaled up to regulators and/or payers?
Sharon conducted a targeted literature search via PubMed using key words ‘HTA’ and ‘environment’ to understand if environmental impact is currently being considered within HTA decision frameworks. The initial search produced almost 900 citations, of which the majority were irrelevant. The references from relevant articles published in 2023 were used to locate other publications and sources.
Here are her key take home points.
Environmental impact is not high on the agenda with current appraisal methods for new medicines…
Despite the increasing interest in sustainability of medicines, a 2023 review by Breslau [4] of 53 HTA guidelines for ten societal value elements† identified only one mention of ‘environment’. This was by the Second Panel on Cost-Effectiveness in Health and Medicine [5].
The Second‡ Panel recommended that the reference/base cases of all cost-effectiveness analyses should report from both a healthcare sector and a societal perspective [6].
Societal healthcare-related inclusions are costs of patient-time, unpaid caregiver-time and transportation to receive care.
Environment is included as a non-healthcare sector impact, along with productivity, consumption, social services, legal or criminal justice, education and housing [5] [7].
…despite European Regulation recognising the need for the sustainability of health systems
This aligns with Note 3 of the new definition of HTA developed though an international collaboration in 2020 [8], which says:
The dimensions of value for a health technology … include clinical effectiveness, safety, costs and economic implications, ethical, social, cultural and legal issues, organisational and environmental aspects, as well as wider implications for the patient, relatives, caregivers, and the population…
However, while the Regulation 2021/2282 of the European Parliament recognises the importance of the sustainability of health systems (EUR-Lex—32021R2282), it does not include the environmental dimension in the five non-clinical assessment domains of HTA [9].
Environmental impact could be a criteria within multiple technology appraisals, but it is not yet clear how to incorporate or assess
Guirado-Fuentes [9] conducted a scoping review of the literature considering the inclusion of the environmental dimension into HTA processes. They identified 22 articles published between 2010 and 2022 which could be grouped under four topics:
For further reading, see Toolan et al. (2023). Environmental impact assessment in health technology assessment: principles, approaches, and challenges [13].
Environmental Impact is not a key HTA/payer decision driver for now, but the growing pressure to reduce emissions is likely to move it up the health policy agenda over time
HTA and pricing frameworks are already complicated enough; adding yet another appraisal criteria is likely to slow decision making down and make it more resource-intensive for everyone.
Despite this, the impact of carbonization on health outcomes and increasing pressure from Governments to reduce emissions is likely to keep moving this up the healthcare policy agenda.
As this happens, environmental impact may become a key consideration in decision making alongside efficacy, safety and quality of life. There may be a need to justify why a less sustainable medicine has been listed on formulary, prescribed or administered where there is a like-for-like choice. It could, in turn, start to influence the standard of care or line of treatment. And this will then start to impact market access and commercialisation strategy, as well as acquisition and partnering deals.
For further insight, this topic could be expanded to a full literature review as there are a number of resources and thought leadership articles in the public domain on this topic. The Royal Pharmaceutical Society has published various Sustainability Policies in this area that provide further suggestions about how changes could be implemented by healthcare providers.1 McKinsey & Company also recently published an article identifying changes that MedTech and pharmaceutical companies could be making [14].
†defined as components beyond health impacts to the treated individual and costs beyond those incurred by the healthcare sector to deliver those interventions. The ten consumption, economic activity, education, environment, family spill over, healthcare system capacity, housing, legal, social services , transportation.
‡ The First Panel was the basis for the seminal book by Gold MR, Siegel JE, Russell LB, Weinstein MC. Cost-Effectiveness in Health and Medicine. New York, NY: Oxford University Press; 1996.
LinkedIn post, August 2023.
Many thanks to Sharon Leadbitter for researching and clarifying the current literature reporting on the Environmental Impact within HTA decision making.
Sharon is a Market Access specialist based in Sydney Australia with over 15 years biopharmaceutical company experience.
If you have any questions about this review or would like to understand how FingerPost can help you build and demonstrate product value ahead of exit or launch, please contact:
Catherine Bacon: cbacon@fingerpostconsulting.com
Nick Melling: nmelling@fingerpostconsulting.com
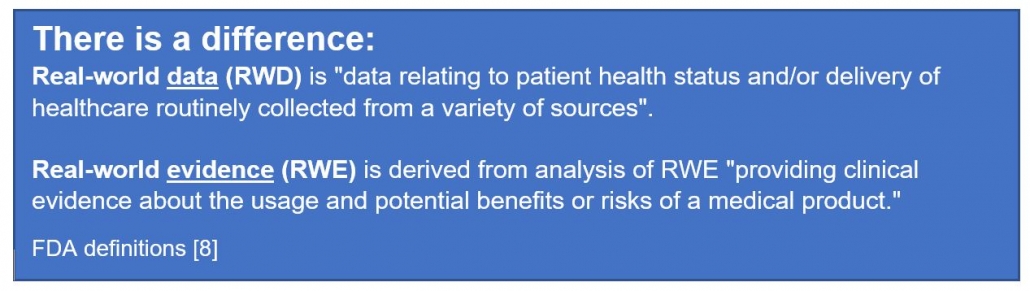
Since 1990, members of the ICH [1] have co-operated to develop guidelines and standards for demonstration of the efficacy, safety and quality of new products. As membership has grown, the guidance documents have been increasingly adopted as the international standard. Consistently satisfying the data needs of reimbursement agencies is yet to reach this level of uniformity. Will authorities agree on, and even mandate, inclusion of RWE into reimbursement submissions?

Reimbursement guidelines ensure that all relevant evidence published in the medical and grey literature is identified and presented systematically for evaluation. In the case of a new medicine, this usually is comprised of the clinical trial data generated for regulatory purposes. HTA landscape reviews across a number of therapeutic areas demonstrate that positive reimbursement decisions continue to rely almost exclusively on direct randomised controlled trials (RCTs) [2]. Exceptions are rare disorders and conditions of high clinical need when decisions are pragmatically made on the available data. Compromised reimbursement decisions may also occur when regulatory approval is given on the basis of single arm studies; and ethics approval for an RCT requires cross-over to be permitted after the primary endpoint.
The landscape reviews also show that the inclusion of analyses based on real-world data (RWD) definitely aid in reducing uncertainty around a decision. The price decrease required from what is “cost-effective” for listing being inversely proportional to the size of the arc of uncertainty. Uncertainty is significantly reduced when an included analysis demonstrates clinical effectiveness [3]; estimates local usage parameters and/or supports applicability of RCT results to the proposed patient population. However, this importance only applies only once a “yes” funding decision has been made.
This is why development of the reimbursement strategy for a new product must start early. In concert with regulatory plans, it is critical to identify the limitations/gaps in the clinical development program relative to the competitive landscape; to determine which type of data will most strengthen the evidence base; and to seek out alternate sources of data to generate this evidence in a timely manner.
The context for inclusion of real-world evidence (RWE) includes initial reimbursement discussions, pharmacoeconomic analyses, and conditional reimbursement schemes [4]. The right RWE can optimise restrictions or conditions associated with a listing, as well as the price achieved. This occurs at both a global and local level from data collection during early access programs, commissioning a clinical audit of hospital records, to requesting ad hoc analyses of a disease registry.
A snapshot of the status of RWE in reimbursement authorities:
Dr Hwee-Lin Wee from the National University of Singapore, presented a session on Real-World Data/Evidence use by Asia’s developing HTA systems during the ISPOR Asia Pacific 2020 Conference. The results of a 2019 survey confirmed that HTA agencies accept clinical effectiveness data from real-world sources as supplementary evidence to RCTs or where RCTs are lacking. Specifically, China, Indonesia, Japan, Malaysia, Singapore, South Korea and Thailand accept pragmatic clinical trials. China, Philippines, Singapore and South Korea publish specific guidance documents on use of RWD/RWE in HTA reviews [5].
This work contributed to the REAL World Data In ASia for HEalth Technology Assessment in Reimbursement (REALISE) working group. This is a collaboration between global experts and 11 Asian health systems. The group has developed non-binding guidance to provide a framework to generate and use real-world data (RWD) / real-world evidence (RWE) in a consistent and efficient manner for drug reimbursement decision-making in Asia [6].
During 2016, the Karolinska Institute, CHE York, University Departments from Argentina, Brazil, Columbia and Chile, ICON and Novartis collaborated to systematically evaluate the sources, characteristics and uses of RWE in South America. Following comprehensive literature and database searches and validation workshops during 2016, Justo and colleagues (2019) found that RWE was being utilised for pharmacovigilance and academic research purposes; little for HTA decision making and pricing negotiations and not at all to inform early access schemes [7].
The FDA has published guidance on the use of RWE to support regulatory decision-making for medicines and medical devices. These data may also support coverage decisions and to develop guidelines and decision support tools for use in clinical practice [8, 9, 10].
Lee et al. (2021) [11] conducted a retrospective analysis of the use of RWE in the cost-effectiveness analysis and budget impact analysis sections of final evidence reports published in the database of the Institute for Clinical and Economic Review (ICER). They identified 33 reports, all of which used RWE, most commonly for disease progression inputs (28.7%) and health care resource utilization and costs (21.1%). In 57% of cases, a retrospective cohort study design was used to collect the data, registry data was the most frequent (41%) data source, and 30% of RWE was industry-sponsored. RWE was rarely used for drug-specific clinical outcomes such as effectiveness (1.5%), adverse drug event rates (0.5%), and discontinuation rates (1.2%).
Malone et al. (2018) [12] interviewed 20 healthcare professionals from 18 different US health organisations about the use of RWE to inform Pharmacy and Therapeutic Committee decisions. Overall, RWE was considered useful, in particular to inform safety monitoring, utilization management, and cost analysis, but less so to guide coverage decisions. When it was used in decision making, pharmacy claims data was referred to by 100% of committees represented; medical claims (80%), Electronic Health Records (27%); Consumer surveys (20%) and Patient registries (13%). The usefulness of published RWE depended on the relevance and applicability, transparency of methods, study design and quality, and timing of any results. Perceived organizational barriers to the use of published RWE included lack of skill, training, and timely study results.
The FDA has also produced a number of guidance documents on communication with payors around RWE [13, 14] and between manufacturers and payors such as formulary committees [15].
In response to the need for consistency and integration of RWE efforts, a 4-year collaboration between researchers, payers, and patients known as the Canadian Real-world Evidence for Value of Cancer Drugs (CanREValue [16], https://cc-arcc.ca/canrevalue ) kicked off in 2017. Five working groups are developing and testing a framework for Canadian provinces to harmonise the generation and use of RWE for cancer drug funding. The aim is to build consistency in the use of RWE at a national level, which will lead to a robust pan-Canadian system supporting sustainability, value for money and improved patient care.
As part of this project Clausen and colleagues (2020) [17] conducted a qualitative descriptive study to understand current issues with the use of RWE in cancer drug funding decisions. The findings suggest that if RWE is to be used in drug funding decisions, there is a need for a cultural shift, improved data infrastructure, committed investment in capacity building and increased stakeholder collaboration.
The value of using RWE in regulatory decision making by the European Medicines Agency (EMA) is well established [18]. The inclusion of RWE in benefit-assessment/HTA evaluations continues to be the subject of numerous initiatives.
The LSE conducted a series of roundtable meetings in 2018 [19] to gain an understanding of the use of RWE across Europe and to assist the pharmaceutical industry to enhance their use of RWE. Three ways to advance were identified:
(a) prioritising the use of RWE by focusing on quality, including credibility of sources, design and methodologies,
(b) by identifying key areas or regions to pilot the use of RWE, and identifying supporting stakeholders, and
(c) by securing a consistent approach by developing an action bias, building best practice case studies, and demonstrating the value of RWE in contributing to decision making.
In a review of RWE policies of the HTA agencies of Sweden, UK, Germany, France, Italy and The Netherlands, Malady et al (2017) [4] found a lack of alignment in request for and acceptance of RWD in contexts of initial reimbursement discussions, pharmacoeconomic analysis and conditional listing schemes. Bullement et al. (2020) [20] found that the use of RWE in NICE submissions of cancer drugs was extensive, and appeared to have provided a valuable source of information to aid the decision making. NICE continues to proactively develop its use and acceptance of RWE. In 2019, a ‘Widening the evidence base’ statement set out NICE’s ambition to use broader sources of data and analytic methods to enhance existing methods and processes. Last year, NICE announced a collaboration with US based Flatiron [21] to explore how RWE can inform the clinical and cost effectiveness of health technologies.
The value of data collected outside of the clinical trial environment is clearly accepted by both payers and manufacturers with potential for use in evaluation and decision-making at all stages of the life cycle of a new medicine.
Representative bodies such as ISPOR and the International Society for Pharmacoepidemiology (ISPE) are collaborating to address the common issues noted as barriers to use of RWE. For example, recommending establishment of a register for RWE study protocols to improve transparency in research methods and analyses use. [22, 23] Numerous others continue to make valuable recommendations on how to move forward. [24, 25]
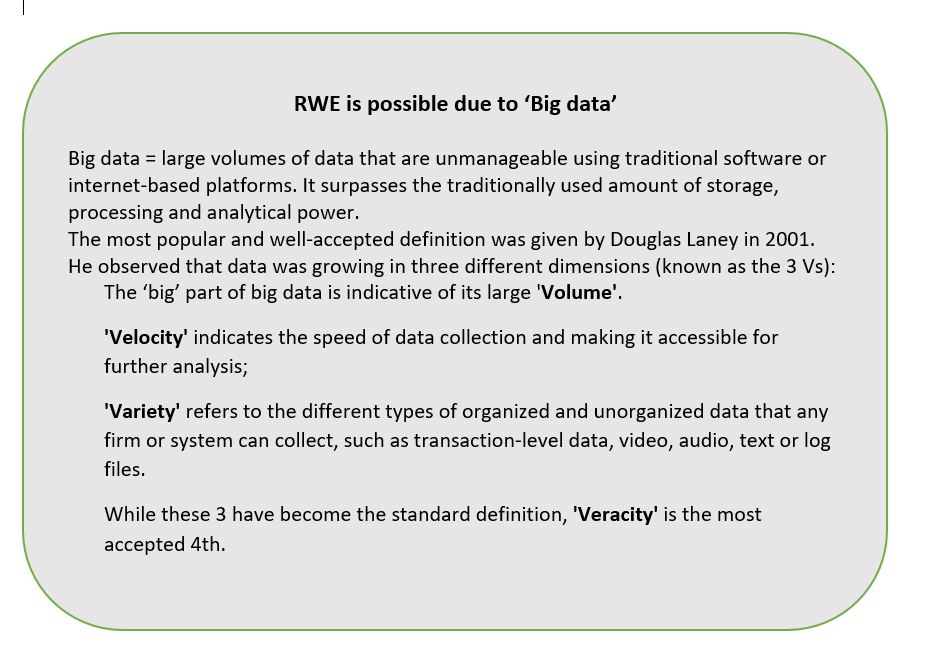
Policy consistency across organisations and jurisdictions is evitable. However, this will require moving beyond the established principles of evidence-based medicine into HTA 2.0, made possible by “big data” (see separate box). Additionally, new definitions of privacy and data security are required in an era where a search engine can know more about your health than your doctor.
Predictions are for a global market for sourcing, generating and providing RWD in a usable format of US$1.64 billion by 2024 [26]. As reimbursement authorities continue to receive more RWE of increasingly higher quality and value, it will become expected.
Image by Erika Varga from Pixabay
True transparency requires more than making information available.
According to Rio Tinto, it was a ‘misunderstanding’ with the local Indigenous community that resulted in the destruction of 46,000 year-old sacred sites in May this year. The company had Government approval and stakeholders had been informed. All boxes checked. Obviously, that was not enough.
Since 2015, the Australian Government has been a member of the Open Government Partnership (OGP), committing to support the goals of increasing the transparency and accountability of government. The first OGP Global Report (May 2019, page 20), identifies these as generally lacking in health procurement decision-making in the 78 nations involved. In this article, I assume procurement includes the registration and reimbursement of therapeutic interventions by the Government on behalf of Australian taxpayers. My thesis being that openness may not necessarily be transparent, using two examples to illustrate.
Example 1. The presentation of options by the Therapeutic Goods Administration (TGA) for which type of medicines would have evaluation status made public.
Option 1: maintain TGA’s current publication arrangements [to not make public]
Option 2: list all applications accepted for evaluation
Option 3: list all applications at two different time points
Option 4: list applications of innovator medicines of highest public interest, but not generic or biosimilar medicines
The explanations given for providing Options 3 and 4 include: ‘Generally, there is less public interest in whether a generic or biosimilar medicine is under evaluation by TGA in Australia’, and ‘Earlier publication of generic or biosimilar approvals prior to ARTG entry allows more transparency of forthcoming competition to sponsors of originator medicines and potentially, purchasers of biosimilar and generic products.’
The TGA has been in the unenviable situation of neither being able to confirm nor deny whether a particular medicine is currently in the evaluation process. Other similar jurisdictions, such as Europe and Canada publish this information. It is a good initiative. The particular drivers of this 2019 consultation on transparency were: from the TGA side, inconsistencies with other agencies, especially evident during joint evaluations of new molecules; from the innovator sponsor side, more time to initiate legal proceedings against potential patent infringing generics/biosimilars and avoidance of liability for damages by the Commonwealth; and from generic/biosimilar applicants, maintain the status quo.
The inclusion of Options 3 and 4 show that there is an awareness of the potential negative commercial/financial implications to applicants and the Government of originator sponsors knowing the timing of registration of a generic or biosimilar. Is this made clear? Does ‘less public interest’ justify being selectively transparent?
Example 2. Measures associated with the ongoing Medicines Australia-Commonwealth Strategic Agreement PBS process improvements include the PBAC preference for greater transparency to be introduced in Public Summary Documents (PSDs) through a standardised approach to redactions.
Objectives of proposed PSD Changes – PBAC (Medicines Australia, Feb 2020)
•Increase transparency of PBAC’s decision-making processes.
•Publish PSDs in an efficient and consistent manner through establishment of a standardised approach to redacting information.
•Provide consumers with access to information to assist with making decisions about their individual health needs.
•Increase the public’s understanding about PBAC decisions.
•Align Australia’s practices with leading international jurisdiction approaches*.
*This refers specifically to the additional, and unexpected, push for PSD inclusion of all clinical data provided in PBAC submissions, irrespective of the publication status nor commercial impact. While no other jurisdiction currently requires it, other countries are considering in response to calls for increased pricing transparency (WHO, WHA, 2019).
While appropriate that the PBAC want to clearly indicate how each recommendation was reached, what is the point of providing even more information in PSDs when the existing format is, realistically, inaccessible to anyone without disease and technical knowledge and an appreciation of the meaning of uncertainty in this context? Inclusion of a summary in lay-man’s language in PSDs would go much further towards openness. It is like providing a patient with a copy of his/her CT scan and the report without an explanation as to what it means.
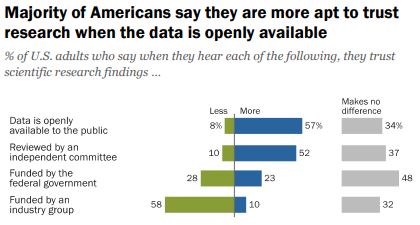
Do we want people to be able to understand the information OR is the fact that it is openly available more important?
According to a 2019 Pew Research survey, it is the later. Americans confidence in scientific findings are most influenced by open public access to data and independent committee reviews. There appears to be no similar survey providing Australian opinions.
Scientific journals are strongly encouraging authors to make datasets open source at the time of study publication with the intent of it becoming a mandatory requirement. Should sponsors of reimbursement submissions expect anything different? It is notable that journals target technical audiences, while PSDs are ostensibly for consumers (patients, healthcare professionals, competitors).
Before public release of information, consideration should be given as to who will use it, for what purpose(s), and the most appropriate release format, which is what the TGA and PBAC have undertaken via consultation in the examples provided. Is it enough?
Note: There is an opportunity to voice your opinion on ‘What does open government mean to you’ as input to the Third National OGP Australian Action Plan 2020-2022.
Image source: Jim Pavlidis
The current review of NICE is a useful foil upon which to consider the announced refresh of the Australian National Medicines Policy. Both are being driven by concern that access processes are not keeping pace with biomedical innovation.
The table below provides a side by side comparison of the two appraisal systems and HTA reimbursement environments. Of interest is the relatively recent increase in NHS responsibility and focus on overall budget impact of reimbursing a new technology.
The need to effectively manage uncertainty whilst still making decisions is a key challenge of providing timely access, especially as patient populations are becoming smaller and more targeted.
 | ||
| Established | NICE became a legal entity in April 1999. First guidance published was an assessment of zanamivir for flu. | The PBAC evolved from the Formulary Committee and became an independent statutory body under s 101 of the National Health Act (NHA) in 1953. Cost-effectiveness was introduced into the NHA in 1998, with the first PBAC Guidelines published in 1992. |
| Responsible for | Technology appraisals (TAs) that assess the clinical and cost effectiveness of health technologies (pharmaceuticals, biopharmaceuticals, procedures, devices, diagnostic agents) and highly specialised technologies (HST). | The primary role of the PBAC is to recommend new medicines for listing on the Pharmaceutical Benefits Scheme (PBS), taking into account the medicine registration, its clinical effectiveness, safety and cost-effectiveness compared with other treatments. |
| Cost Recovery Fees | New regulations came into effect 1 April 2019 allowing NICE to charge for appraisals. A single TA costs approximately US$ 156 K for large, and US $40 K for small companies. | Significant increases from 1 July 2019, with the full process to listing, including one major submission, costing approximately US$ 300 K. A second stage is to be implemented from July 2020 but may be delayed. |
| Current review | Review of Methods and Processes Announced July 2019 | Federal Government review of the National Medicines Policy. Formerly announced October 2019 |
| Review Scope | Evaluation methods of technology appraisals and highly specialised technologies (HST). The QALY as a decision tool is not included with NICE indicating that changes to methods will only occur if there is a compelling case. | Consider whether the policy in its current form continues to meet the needs of Australians. Task force established, Terms of Reference pending. On-hold as resources directed to COVID-19. |
| Stakeholders | Substantial interest from external stakeholders and interest groups. | Wide-spread interest and involvement of health stakeholders, patient and consumer groups. |
| Review Concerns | – access and impact on patients -affordability in the NHS -clearer criteria for HST -improved representation of the patient view -inclusion of non-health benefits -success of the life sciences sector | -timely and equitable access to new, innovative therapies -affordability (Govt, community, patient) -supply chain (shortages, rebates) -integration of patient voice -viable medicines sector |
| Average evaluation | 16.0 months (2009 – 2016) | 4.5-month cycle from submission to PBAC consideration |
| Average time registration to reimburse (2012-2017)* | 4.2 months | 13.8 months |
| % NCEs registered, subsequently reimbursed (2012-2017)* | 84.3% (29% not funded for full licence, and 5% only recommended for the Cancer Drugs Fund). | 46% |
| Pricing | Voluntary Pricing and Access Scheme (VPAS) came into effect in January 2019, replacing the Pharmaceutical Price Regulation Scheme (PPRS). VPAS promises more and faster NICE appraisals for NCEs and speed up of appraisals for non-cancer medicines to be in line with cancer medicine timelines. | Following loss of the Pharmaceutical Benefits Pricing Authority (PBPA) in 2014, the Department of Health has become the sole arbitrator of pricing. Reforms in 2015 introduced statutory price cuts at 5, 10 and 15-year anniversaries from PBS listing targeting patented medicines. |
| Last major review | Introduction of end-of-life criteria and formation of the Cancer Drugs Fund (CDF) that relaunched under NICE in 2016. | Strategic Agreement 2017-2022 – Streamlining PBS Processes in progress. PBAC Guidelines Version 5.0 published September 2016. |
| Parliamentary level reviews | An inquiry by the All-Party Parliamentary Group (APPG) on Access to Medicines highlighted demand for wider value thresholds and modifiers, better management of uncertainty and improvements in the use of data and real-world evidence be brought into the methods. | Senate Inquiries into the Supply of Chemotherapy Drugs (2013); Availability of New, Innovative and Specialist Cancer Drugs in Australia (2015) and Funding for Research into Cancers with Low Survival Rates (2017). Recommendations accepted and implemented by Goverment to varying degrees. |
| US trade deals | UK-US post-Brexit trade agreement under negotiation. While US propose to redesign the NICE process, NHS England has been taking steps to increase its role in affordability and to effectively bypass NICE when appraising innovative medicines. NHS will play a key role in applying pressure on drug prices irrespective of any trade deal. | 2005 AUSFTA was instrumental in introducing major reforms to PBS listing process. Many, such as Independent Reviews and Public Summary Documents have been diluted, or configured to suit DoH purposes. For example, recent call for 100% transparency of clinical data. Others, such as PBAC hearings, continue to be invaluable. |
| Budget impact (Ghabri and Mauskopf 2018). | NHS Commercial Medicines Unit responsible for Patient Access Schemes and negotiation of outcomes-based pricing agreements. Introduction of the budget impact test makes a high budgetary impact the reason for manufacturers to reduce their price, either directly or indirectly, by lowering the cost-effectiveness threshold. | Since 2010–2011, any recommendation by PBAC that has a financial impact for the Federal Government is considered by the cabinet. The estimated financial impact of a drug on the Australian drug budget is a significant predictor of the PBAC recommendation for reimbursement |
| Managed Entry | Review will consider how to better managing uncertainty around early data and surrogate endpoints, such as collecting RWE while trials pending. | Process available since February 2011. Infrequently utilised following outcomes of initial agreements, . |
| Political Interference | Health Secretary Matt Hancock’s recent intervention in funding decisions around cystic fibrosis drugs, Orkambi and Trikafta, shows that NICE’s independence can be compromised. | Parliamentarians exert pressure on the Minister of Health (MoH) to enact listings once a positive PBAC recommendation has been made. However, MoH can deflect back onto Sponsor for not meeting the advice (conditions) of the PBAC recommendation. Strong commitment to this ‘independence’ of the PBAC. |
| Role of consumer and patient advocacy groups | The Review proposes new responsibilities for external stakeholders, such as delivering quantitative evidence of disease modifiers to be used in assessments and decision making. Disparity of resource and HTA skills within the patient group community to address these issues could risk furthering the inequality and lead to a misrepresentation of some therapy areas. | Increasing call, and opportunities for patient voice to be heard during evaluation of new medicines. Pilot initiative whereby patient groups meet with PBAC members prior to consideration of a relevant submission, is to be formalised. Industry increasingly engage with patient groups, especially around relevance of clinical endpoints and capturing real impact of disease. Government focus on transparency has lead to development and launch of a publicly accessible Medicines Status Website. |
References and Notes:
Lanning R. Does NICE hold the cards to drug pricing and reimbursement? PharmaField 30 March 2020.
Boyd N. A NICE Transformation? PharmaTimes Magazine, April 2020, p. 25-26.
*Medicines Australia 2018 COMPARE 4 Report
As the Sponsor of a new medicine seeking listing on the national Pharmaceutical Benefits Scheme (PBS), pricing used to be relatively straightforward once a positive Pharmaceutical Benefits Advisory Committee (PBAC) recommendation had been received.
The Pharmaceutical Benefits Pricing Authority (PBPA), defunct as of 1 April 2014, would determine the price based on: (1) PBAC advice accompanying the recommendation and, (2) the Sponsor’s pricing submission. Calculation methods were explained in the PBPA Manual (last edition 2009) and, sometimes further discussion with the Pricing Section of the Department of Health (DoH) was required to finalise, for example, exact amount of cost offsets etc. From a company perspective, as long as you stayed above the specified ‘global floor’, the local price was a matter for the local affiliate.
Prior to August 2007 reforms, when the PBS was split into two formularies (F1, F2) based on the availability of a generic brand following lost of exclusivity, the ‘reference pricing method’, was most commonly used. This is where drugs are priced based on their relative safety and efficacy, as determined by the PBAC and documented in Therapeutic Relativity Sheets. Where drugs are considered to be of similar efficacy and safety, the lowest priced brand or drug sets the benchmark price (‘cost-minimised’).
The ‘cost plus method’, where a gross margin of 30% is considered reasonable based on costs declared by the Sponsor in the PB11b form, became applicable to a larger range of drugs (F2, multiple brands) after the reforms, with reference pricing only applying to F1 (single brand, on patent) drugs.
A Price Disclosure policy was introduced for F2 medicines. This was necessary for the Government to realise the savings when generic brands cost-minimised to originator brand prices. Generic companies were using the excess margin above cost, due to lower development investment, to incentivise prescribers and pharmacists. Various iterations to price disclosure processes have been extremely effective in finding the lowest viable price. This policy is almost wholly responsible for over 30% of PBS services currently being below the general patient co-payment ($40) and in no need of Government subsidy.
Continuing adjustments to policies and Health Technology Assessment (HTA) evaluation guidelines maintained Government pressure on prices and risk mitigation. This resulted in the need for Special Pricing Arrangements (SPAs) and Risk Share Agreements (RSAs), respectively. Rebates of 100 % are now the norm. When ‘effective’ (i.e. real) prices being paid for new medicines are lower than the global floor these must be confidential otherwise long delays to PBS listing are likely. This is because of the increasing number of countries who base their local drug prices on those paid by a basket of countries (international reference pricing). This approach is proposed in the USA as part of the Pelosi bill.
Where a comparator is listed under a SPA, preparing an economic evaluation has become a guessing game as to the effective price. Needing to use the published list price disadvantages a new medicine in the evaluation process.
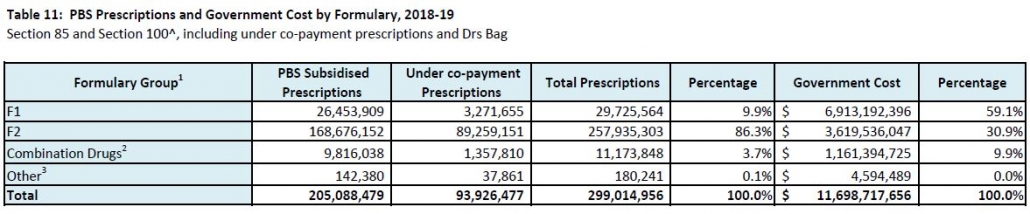
Things became more complicated when the PBS Access and Sustainability Package, introduced in mid-2015, included a 5% price cut to all F1 brands listed for five or more years. As the Table shows, F2 is a smaller source of potential savings for the Government. Anniversary cuts were extended to include 10 and 15 year listing marks as part of the 2017 Commonwealth-Medicines Australia Strategic Agreement.
Affiliate pricing of a new medicine is increasingly centralised by companies as Government payers push to use taxpayers’ money wisely. In both situations, prices expected, based on perceived and relative value, may be very different to those modelled on the available clinical evidence.
Collaboration between payers and pressure for reform (2), including transparency of real prices, may result in pricing becoming very simple if companies choose to set only one global price.
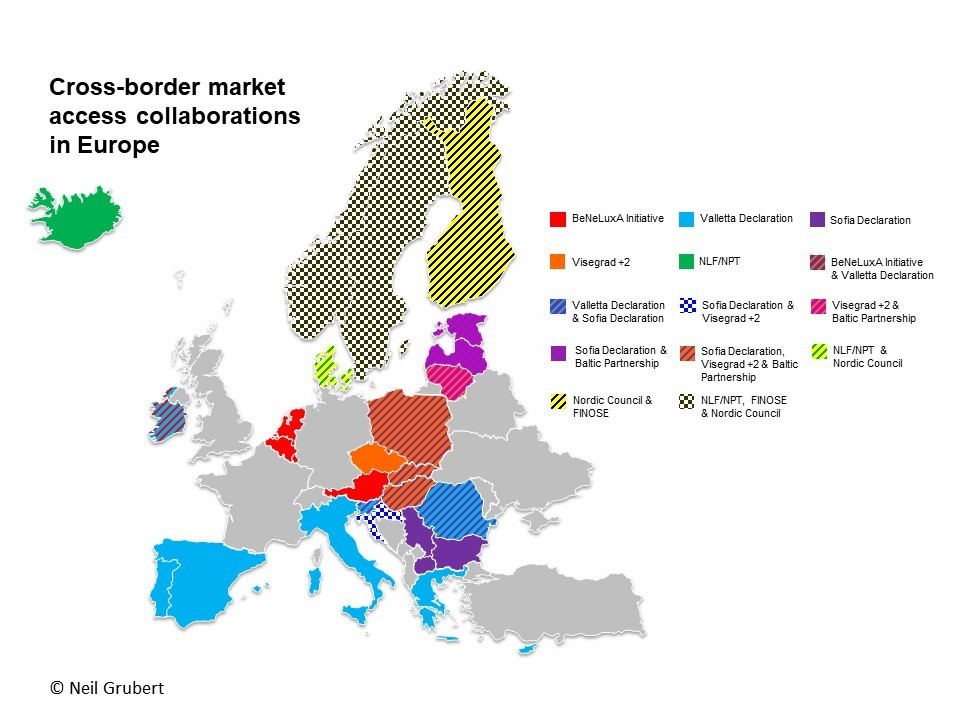
(1) Impact of introduction of value-based pricing in Germany (2) See articles by Neil Gubert on cross-border collaboration and the Commonwealth Fund on drug pricing reform.
Photo source: BIG Maze, National Building Museum, Washington DC, 2014
Mandatory reporting of medicine shortages† from 1 January this year has seen new notifications to the Australian Therapeutic Goods Administration (TGA) increase by over 400% (n=1,455 for 2018-19) compared to the previous period (n=274). Currently, over 10% of the drugs on the TGA ‘list’ are classified as critical with the potential to have a life-threatening or serious impact on patients.

The FDA Drug Shortages Task Force Report, released today, compared drugs that went into shortage from 2013 to 2017 to similar drugs that did not go into shortage. Drugs in shortage were more likely to be relatively low-price, in particular genericised sterile injectables, including anaesthetics, chemotherapy and pain treatments. Australian hospital (2017) and European Association of Hospital Pharmacists (EAHP) 2018 Medicines Shortages surveys reported similar groups of drugs most often impacted (Figure 2 from the report shown).
Shortages can and do have a significant impact on patient care, especially when there is little or no notice. Required reporting provides authorities, health care professionals and patients time to prepare. Unfortunately, this measure, like those taken elsewhere in the world will not reduce the problem because:
(1) Commodity pricing policies
Treating drugs as commodities exposes them to the rigours of supply and demand.
Although demand is increasing globally, due to ageing populations and availability of more effective medicines, the FDA Task Force found ‘prices rarely rose after shortages began, and during shortages, production typically did not increase enough to restore supply to pre-shortage levels.’ This points to a ‘broken marketplace‘, where scarcity does not result in the price increases predicted by basic economic principles.

As the graph shows the relationship between introduction of a preference policy in the Netherlands, where only the cheapest medicine for a specific disorder is reimbursed, has resulted in a greater proportion of these medicines being in shortage.
Companies seeking to enter the generic marketplace may not have the manufacturing history and quality safeguards in place to ensure sustainable supply. This is despite providing guarantees to Governments who preference suppliers based on price.
The production and supply of pharmaceuticals is regulated by Good Manufacturing Practice (GMP), as prices decrease, companies may consolidate manufacturing facilities to maintain profitability. Hence, those medicines with the most competition will be the most vulnerable to shortages.
(2) Expansion of reference pricing
As more Governments, including the US (see Pelosi Lower Drug Costs Act 2019) introduce reference pricing into their drug procurement policy mix, others are losing their appetite for the quid pro quo of access to new products at ‘hidden’ prices. The Dutch Health Minister has recently called to ignore the confidentiality of pricing agreements, while the Australian pharmaceutical industry was rocked last year by the presentation of a poster listing rebates by ATC code at an international conference. In addition, changes to supply chain rebate arrangements continue to be progressed by the Australian Government despite concerns around the impact on availability of new drugs.
There is a real possibility that companies will set a price for a product and that will be the price, irrespective of country. This will restore the marketplace but patients in countries that have come to expect, and demand, substantial discounts on new medicines will be left waiting for access.
(3) Solutions to date have been ineffective

The EAHP 2018 survey found that medicines shortages have become more troublesome since the last survey in 2014, with 91.8% respondents reporting shortages impacting patient care. The FDA Task force found that the number of ongoing drug shortages has been rising, and that their impact is likely underappreciated. Note: the FDA infographic shows shortages averted, the how likely includes requested intervention by other suppliers.
Manufacturing issues continue to be the most common reason for supply shortages. As reported in 47% of cases to the TGA in 2018-19; and 37%, plus 27% other quality issues, to FDA in 2012. Medicines are not commodities.
The FDA conclude that: ‘The root causes of shortages involve economic factors that are driven by both private- and public-sector decision-making.’
Private sector decisions serve business interests. While public sector decisions aim to benefit societal, and political, interests. The Task Force suggests quality ratings of manufacturing facilities and new contracting approaches with incentives as possible levers.
In the meantime, there will always be someone seizing the day, in this case, a plethora of global wholesalers!
Notes: † Defined as when supply of a medicine in Australia will not, or will not be likely to, meet the demand for that product in Australia any time within the next 6 months; *Reportable medicines are Registered Schedule 4 (Prescription Medicine) or Schedule 8 (Controlled Drug) products, and certain non-prescription medicines considered critical and listed in the relevant legislative instrument. Chain photo from Google Images
Over 30% of all prescriptions written in Australia for PBS-listed medicines are self-funded as they cost less than the relevant Co-payment (under co-pay).
General patients (co-pay $40.30, 1 Jan 2019) are the sole recipients of this cost-shifting as the dispensing fee ($7.29) is greater than the Concessional co-pay amount ($6.50).
So why do the 8% of Services to General patients account for over 30% of Government PBS/RPBS expenditure?
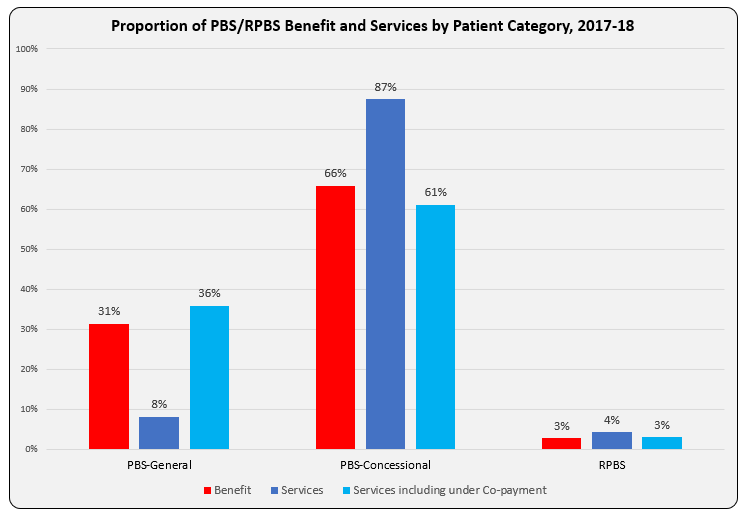
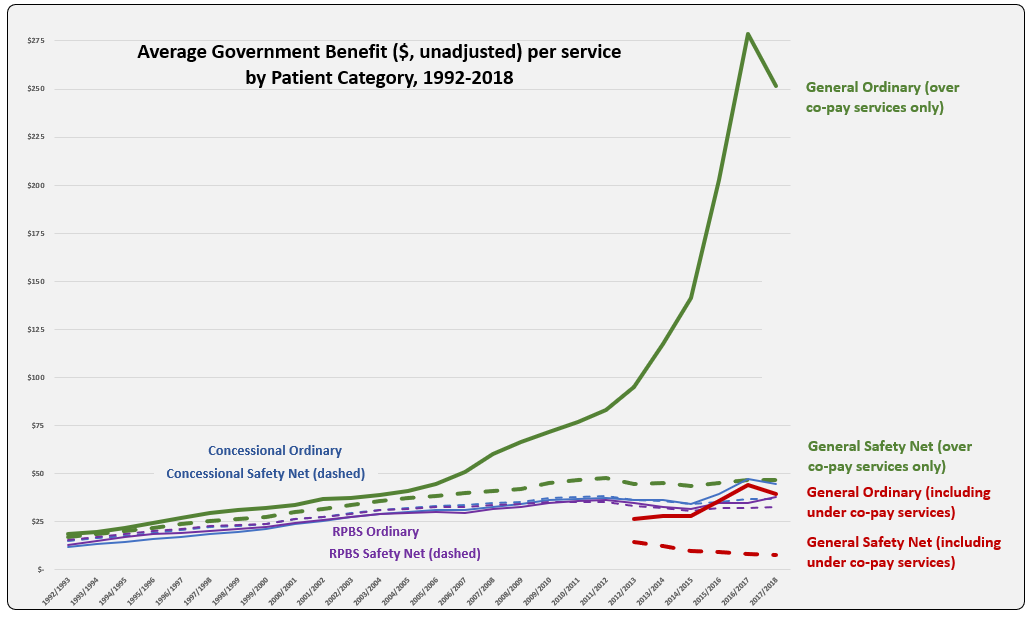
The bar graph shows Benefit paid and differences in proportion of Services attributable to patient categories with and without inclusion of under co-payment numbers. Another way to present this, and as reported in the annual PBS expenditure & prescription tables, is as Average Government Benefit paid per Service.
The line graph shows the evolution of Average Benefit per Service by patient category over time. This graph is based on figures downloaded from Medicare Australia website (includes both Section 85 & Section 100). The total services (approximately 205 K) match the prescription numbers presented in the PBS Expenditure and Prescription Report for the same periods, which exclude under-co payment prescriptions (since reporting started in 2012-13).
Why is the Average Benefit per Service currently over five times higher for the General patient category compared to Concessional?
Is there a difference in the demographics of General and Concessional patients such that higher cost (F1) medicines are prescribed more frequently to General category patients?
| Benefit paid per service ($) by ATC | CV | CNS | Anti-Infectives | GI | Respiratory | Oncology-Immuno | Other |
| 2017/2018 | $ 15.24 | $ 28.65 | $ 149.68 | $ 31.64 | $ 46.16 | $ 966.48 | $ 62.98 |
In recent years, the peak and drop for average benefit paid per service for the General ordinary category mimics that of usage of new Hepatitis C treatments. Is there disproportionate prescribing of these and other higher cost drugs, such as oncologics and immunomodulators, between categories? To test this, benefit figures were downloaded from the Medicare Australia website for Hepatitis C medicines and reveal a split between General and Concessional patient categories of 39% to 61% in $1.37 billion paid by Government during 2017-18. Total service numbers (72,266) show a similar ratio with General 37% and Concessional 63%. For the ImmunOncology medicine, Nivolumab (Opdivo, BMS) total services (40,560) were split General 32% to Concessional 65% in 2017-18.
Perhaps the cause is an artefact of the huge volume, relative to General patients, of low cost (F2) items prescribed, and paid by Government for Concessional patients? Rosuvastatin and Atorvastatin had the highest prescription volumes in 2017-18, of these 37% and 30%, respectively were under co-payment prescriptions.
As a proportion of over co-payment prescriptions in 2017-18, Safety Net (SN) accounted for by 1.3% of the General patient category and 18.2% Concessional. The addition of approximately $40 and $6.50, respectively per script to Government expenditure is unlikely to be responsible for the large difference in average benefit per service paid, given the General SN category is so small.
Suggestions on what may be driving this difference are welcome. Hope you can provide me with a D’oh moment!
Sources: Simpsons; Medicare Australia Statistics; PBS expenditure prescriptions report tables
Like it or not, product and service providers to the PBS are in competition.
The winners and losers during development and roll-out of the 2015 PBS Access and Sustainability Package (PASP) left no doubt about that.
A collaborative approach within the sector, to increase the size of the currently diminishing pie, will be more sustainable and deliver better health outcomes.
Manufacturer revenues accounted for approximately 70% of total Government Expenditure on the PBS/RPBS in 2017-18. In terms of costs, around 40% goes to innovator companies with single brand medicines in formulary F1; 20% to suppliers of multi-branded medicines in F2; and the remaining 10% for Combination products. The overall split, volume-wise, of prescriptions by formulary was F1, 11%; F2, 85% (half under co-payment and not represented in chart below); and Other, including combinations, 4%.
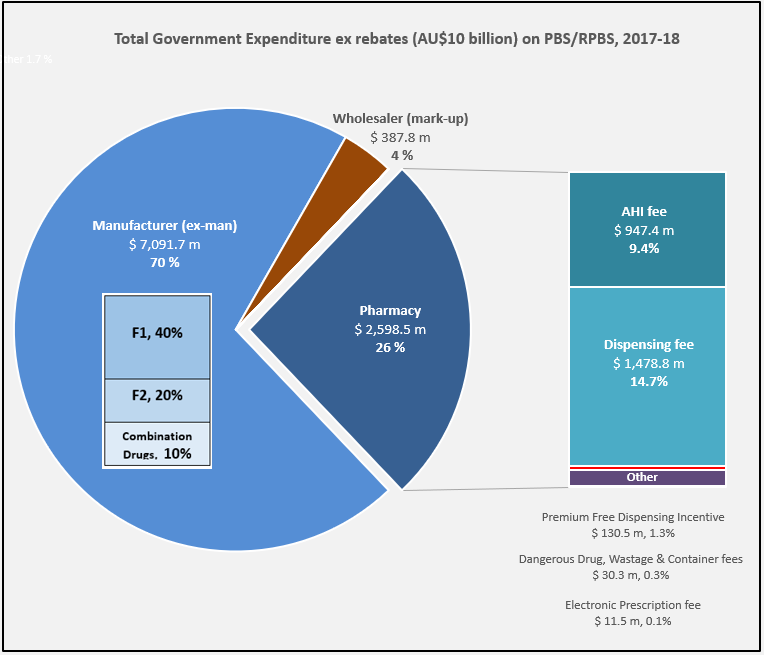
Wholesalers are remunerated via the regulated mark-up on ex-manufacturer price, currently 7.52%. This is agreed as part of the 5-year Community Pharmacy Agreement (CPA) negotiated with the Government of the day by the Pharmacy Guild. In 2017-18, payments to wholesalers represented only 4% of total Government expenditure on the schemes.
In their 2016 Submission to the King Review of pharmacy remuneration and regulation, the National Pharmaceutical Services Association (NPSA) re-iterated their view that the funding provided to wholesalers under the 6CPA is inadequate and unsustainable. This is even without including the impact of direct distribution to pharmacy model selected by some manufacturers.
The Community Service Obligation (almost $ 200 million per year) divided between full service wholesalers is not captured in the pie chart. However, a minimal increase on the previous CSO amount and a loss of indexation during negotiation of the 6CPA, raises the question is anyone representing wholesalers at the table with Government?
The 2015 PASP/6CPA introduction of a flat, but CPI indexed Administration Handling and Infrastructure (AHI) fee successfully uncoupled community pharmacy remuneration from the price of medicines, and added to the growing range of professional services being remunerated. In addition to existing fees for dispensing, electronic prescriptions and incentives, such as to provide premium free medicines.
This approach has, and is, largely protecting pharmacy from the ongoing financial squeeze being experienced by manufacturers and wholesalers due to price disclosure, successive reforms and Department of Health activity.
Many of the professional service payments and pharmacy revenue, such as $600 m for the new Dose Administration Aid program and Minister Hunt announcements at APP2019, are not captured in the 26% of Government expenditure on the PBS/RPBS shown in the chart. For example, Clause 3.5 of the 6CPA notes: ‘The Commonwealth also estimates that community pharmacy will receive up to a further $4.8 billion from dispensing pharmaceutical items that are priced below the Maximum CoPayment.’ (1)
Bruce Annabel noted in a recent AJP article that ‘on average, pharmacies are receiving circa $30,000 pa services income’ with some generating over $200,000 pa.
With the PSA recently announced to join the 7CPA negotiations, and SHPA at APP2019 also wanting to play a role, as hospital pharmacists oversee more than 20% of annual PBS expenditure, there are going to be some unfamiliar faces at the table, very likely facing a new Minister of Health.