Three slices of the PBS
Like it or not, product and service providers to the PBS are in competition.
The winners and losers during development and roll-out of the 2015 PBS Access and Sustainability Package (PASP) left no doubt about that.
A collaborative approach within the sector, to increase the size of the currently diminishing pie, will be more sustainable and deliver better health outcomes.
(1) Manufacturers
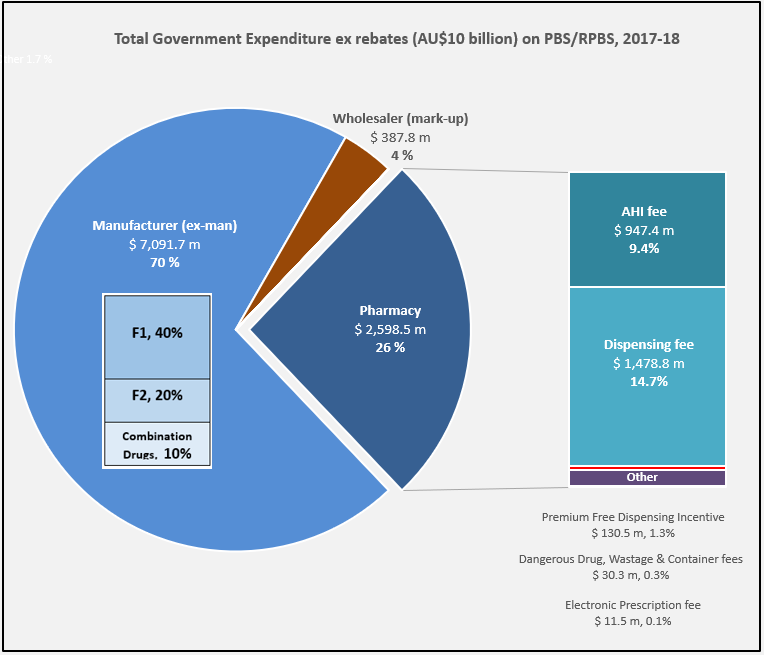
Manufacturer revenues accounted for approximately 70% of total Government Expenditure on the PBS/RPBS in 2017-18. In terms of costs, around 40% goes to innovator companies with single brand medicines in formulary F1; 20% to suppliers of multi-branded medicines in F2; and the remaining 10% for Combination products. The overall split, volume-wise, of prescriptions by formulary was F1, 11%; F2, 85% (half under co-payment and not represented in chart below); and Other, including combinations, 4%.

(2) Wholesalers
Wholesalers are remunerated via the regulated mark-up on ex-manufacturer price, currently 7.52%. This is agreed as part of the 5-year Community Pharmacy Agreement (CPA) negotiated with the Government of the day by the Pharmacy Guild. In 2017-18, payments to wholesalers represented only 4% of total Government expenditure on the schemes.
In their 2016 Submission to the King Review of pharmacy remuneration and regulation, the National Pharmaceutical Services Association (NPSA) re-iterated their view that the funding provided to wholesalers under the 6CPA is inadequate and unsustainable. This is even without including the impact of direct distribution to pharmacy model selected by some manufacturers.
The Community Service Obligation (almost $ 200 million per year) divided between full service wholesalers is not captured in the pie chart. However, a minimal increase on the previous CSO amount and a loss of indexation during negotiation of the 6CPA, raises the question is anyone representing wholesalers at the table with Government?
(3) Pharmacy
The 2015 PASP/6CPA introduction of a flat, but CPI indexed Administration Handling and Infrastructure (AHI) fee successfully uncoupled community pharmacy remuneration from the price of medicines, and added to the growing range of professional services being remunerated. In addition to existing fees for dispensing, electronic prescriptions and incentives, such as to provide premium free medicines.
This approach has, and is, largely protecting pharmacy from the ongoing financial squeeze being experienced by manufacturers and wholesalers due to price disclosure, successive reforms and Department of Health activity.
Many of the professional service payments and pharmacy revenue, such as $600 m for the new Dose Administration Aid program and Minister Hunt announcements at APP2019, are not captured in the 26% of Government expenditure on the PBS/RPBS shown in the chart. For example, Clause 3.5 of the 6CPA notes: ‘The Commonwealth also estimates that community pharmacy will receive up to a further $4.8 billion from dispensing pharmaceutical items that are priced below the Maximum CoPayment.’ (1)
Bruce Annabel noted in a recent AJP article that ‘on average, pharmacies are receiving circa $30,000 pa services income’ with some generating over $200,000 pa.
With the PSA recently announced to join the 7CPA negotiations, and SHPA at APP2019 also wanting to play a role, as hospital pharmacists oversee more than 20% of annual PBS expenditure, there are going to be some unfamiliar faces at the table, very likely facing a new Minister of Health.
Sources: Department of Health Expenditure & Prescriptions Report; PharmaDispatch; Google Images


