Global epidemic?

The statistic is startling: between 2018 and 2040, global cancer mortality will increase by 63% due to demographic changes alone.

The bulk of this impact is projected to be experienced by low and middle income countries as their, generally much larger,  populations age and economic development moves the cancer mix profile closer to those observed in high-income nations. Even now, although 59% of cancer cases occur in middle- and low-income countries, they see 71% of cancer-associated deaths.

As people live longer because they are not succumbing to previously fatal conditions, the proportion of populations for whom cancer is the cause of death will increase. It is this burden that the tag ‘epidemic’ is being used to label.

Australian age-standardised death rates, by broad cause of death, 1907–2016

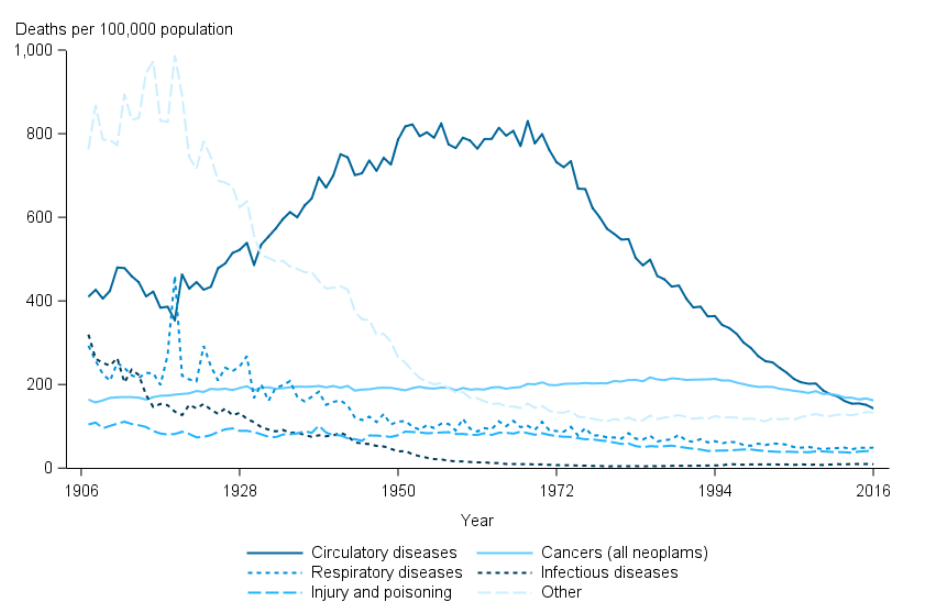
In Australia, the changes in cause of death over time due to improvements in hygiene and healthcare, show that the age-standardised rates for cancer have not altered dramatically over the past century. In fact, cancer (all neoplasm) deaths, after adjusting for differences in age structure, peaked in 1985 (217 deaths per 100,000 population) and have subsequently declined to the 162 deaths per 100,000 population recorded in 2016.

Australia rated poorly on Cancer Preparedness for workforce density (in particular, radiation oncologists, clinical oncologists and surgeons); the capacity of radiotherapy equipment to meet patient need; and the change in out-of-pocket expenditure over 10 years.

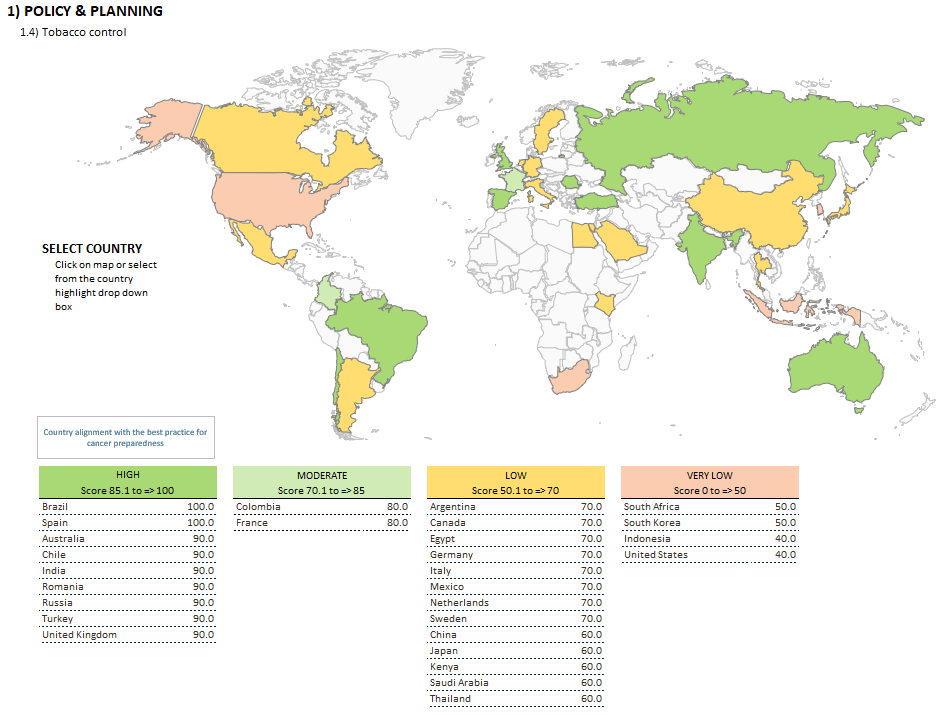
To allow bench marking and initiate discussion on best practice, as part of the World Cancer Initiative, the Economist Intelligence Unit (EIU) Healthcare has published an Index of Cancer Preparedness (ICP) combining findings for 45 separate data points to provide a comprehensive overview of how well the 28 included countries are doing in the key areas of this challenge. The study was sponsored by Novartis, Pfizer and Roche.

The associated white paper describes the need for coordinated services across prevention, early diagnosis, treatment, palliative care and survivor support for effective cancer control. It describes elements that indicate the preparedness of a healthcare system to cope with the existing and projected burden including investment, national cancer control plans, accessible general health system and governance & population-based cancer registries.

The mortality-incidence (M:I) ratio (the number dying of cancer in a given period divided by the number of new cases) is used as a measure of healthcare system success against cancer. The EIU found that this ratio correlates closely, and negatively, with GDP. One of the biggest influences in poorer performance countries is that their healthcare systems are less successful in finding and treating curable cancers.

An interactive Excel workbook of the indicators and scores is available (here) by country and can produce comparative maps like that show below for tobacco control policies.

Sources: Image;  AIHW Deaths in Australia 18 Jul 2018, Figure 4.2; WHO International Agency for Research on Cancer 

Survival by cancer stage at diagnosis

Cancer Australia continues to develop the National Cancer Control Indicators (NCCI) resource with a new data release presenting population-level national data on relative survival by stage at diagnosis for the 5-year period 2011-2016 for Australia’s highest incidence cancers. The data is available by age, gender, socioeconomic status (SES) and location.

The findings confirm that outcomes for Australian cancer patients mirror those reported for other jurisdictions. The positive impact of national screening programs on detecting cancers at earlier stages is clearly evident.

Stage at diagnosis

  • Over 75% of newly diagnosed cases of breast and prostate cancers and melanomas were stage 1 or 2 cancers.
  • The proportion of colorectal cancers diagnosed at more advanced stages was higher in people aged <50 years than those 50 years and over.
  • In 42% of newly diagnosed cases of lung cancer the disease had already metastasized (stage 4). Only 18% were diagnosed at early stages 1 or 2.
  • For breast cancer, people aged 50 years and over had a higher proportion of stage 1 cancers at diagnosis than those aged less than 50 years.
  • For lung cancer, melanoma, and prostate cancer, persons aged less than 50 years had a higher proportion of stage 1 cancers than persons aged 50 years and over.
  • The proportion of cancers diagnosed at early stages was lower in remote and very remote areas compared to major cities and regional areas.

Survival by stage at diagnosis

  • For metastatic cancers (stage 4), survival was higher among people living in major cities compared to regional areas at 1 year (20% compared to 16%), 3 years (6% compared to 4%) and 5 years from diagnosis (3% compared to 2%).
  • For metastatic cancers (stage 4), survival was higher among people living in the highest SES areas (SES5, 25%) compared to lower SES areas (SES1-3, 17%) at 1 year from diagnosis.

Males had lower survival by stage at diagnosis than females

  • For stage 1 cancers at 5 years from diagnosis, survival for males was 62% compared to 75% for females.
  • For stage 3 cancers at 1 year (survival for males 54% compared to females 64%), 3 years (21% compared to 32%) and 5 years from diagnosis (14% compared to 22%).
  • For stage 4 cancers at 1 year from diagnosis (18% compared to 22%).

Survival progressively decreased with increasing time from diagnosis

Stage 1 cancers survival was 91% at 1 year, 76% at 3 years and 68% at 5 years.
Stage 2 cancers survival  was 70% at 1 year, 42% at 3 years and 32% at 5 years.
Stage 3 cancers survival was 58% at 1 year, 25% at 3 years and 17% at 5 years.
Stage 4 cancers survival was 19% at 1 year, 5% at 3 years and 3% at 5 years.

Source: https://ncci.canceraustralia.gov.au/outcomes;

Cancer Australia’s Stage, Treatment and Recurrence (STaR) projectCancer Australia, the state and territory population based cancer registries, the Australasian Association of Cancer Registries, and Australian Institute of Health and Welfare have collaborated to collect and combine data on incidence by stage at diagnosis data with mortality data from the National Death Index (NDI), for the top five high incidence cancers.