Same bed, fewer different dreams?

Tackling a burgeoning inbox always reveals a few gems, such as the article by Ting Wang et al. published last month in ISPOR’s journal Value in Health (2018;21:707-714).

Wang and colleagues developed separate surveys for international innovative pharmaceutical companies (n=19 companies with 29 respondents) and Regulatory (n=7; 13 respondents) & Health Technology Assessment agencies (n=8; 12 respondents) from Australia, Canada, and Europe. Questions referred to the past 5 years and alignment of regulatory and HTA evidence requirements and synergy of processes.

The findings are not surprising to those working in the HTA space for more than 5 years. In particular, with regard to the increasing need for HTA requirements to be included earlier in drug development with unanimous responses from the three key stakeholders (Figure 1, bottom statement). The high drop-out rate of molecules as they move along the development continuum and associated sunk costs mean that early studies focus on efficacy and safety variables. Collection of variables for economic evaluations (e.g. Quality of Life at specific time points, resource use, follow-up beyond primary efficacy parameter, subsequent treatments, etc.) to demonstrate cost-effectiveness is usually left to Phase III and too late for fast-track/priority reviews based on Phase II data. Once a medicine is registered, the opportunity to collect comparative data disappears, and often with it the ability to demonstrate the real value of the new medicine over existing treatments to a healthcare system.

Figure 1: Company respondents’ views on the regulatory and HTA requirements


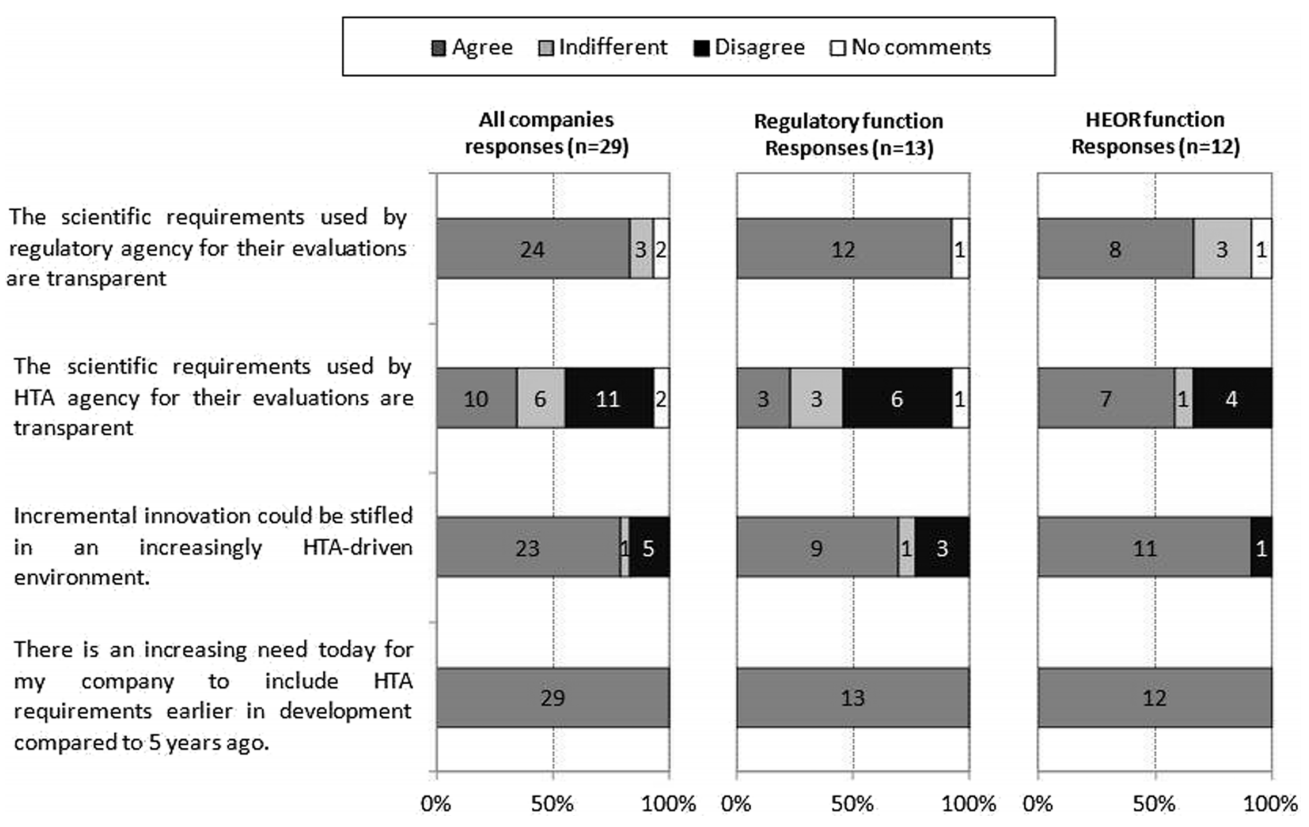
Abbreviations: HEOR Health Economics, Outcomes and Research

Figure 1 also shows that the potential negative impacts on innovation by HTA are recognised across the stakeholder groups as incremental gains are considered not to be rewarded by current HTA processes. Further education around HTA may drive policy changes that recognise and stimulate innovation in the sector.

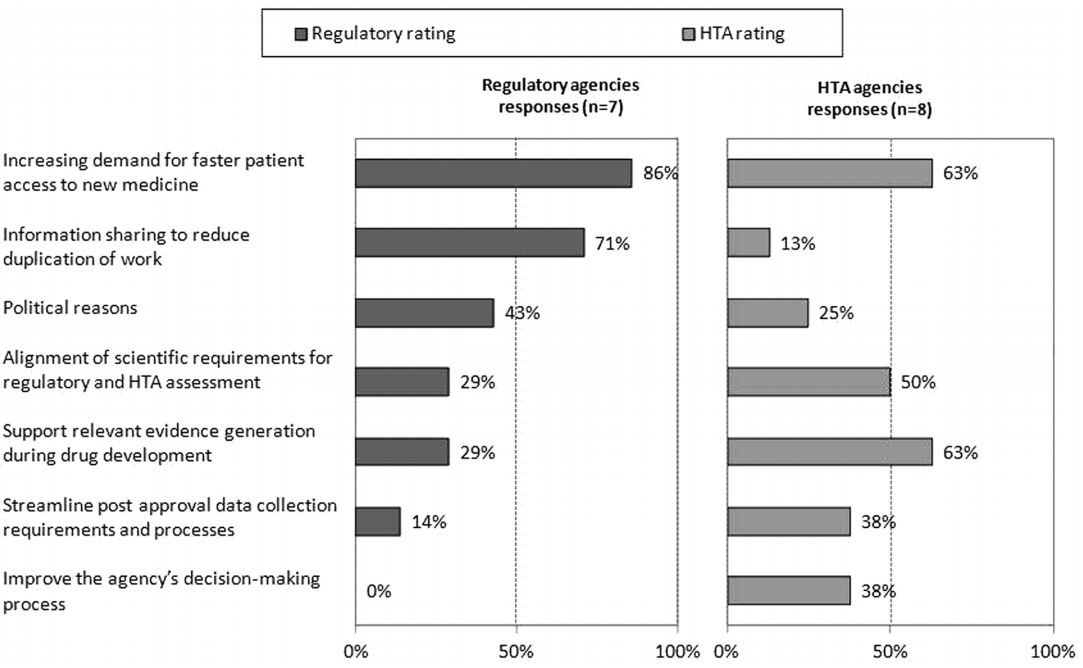
Surprisingly, HTA agencies appear less concerned than their regulatory counterparts of the pressures to speed time to access to new medicines (as shown in Figure 2). The value of sharing of information to reduce duplication is also mismatched. This may be a consequence of the lack of clarity in differences in data requirements for the evaluations, which is alluded to by the higher response rate from HTA agencies on the need to align scientific requirements for the two processes. HTA evaluations are based on comparative efficacy and safety as applies to local clinical practice, whereas regulatory agencies focus on overall risk : benefit. The comparator is usually the currently most prescribed product used for treatment in a market, and costs are based on local circumstances. As such, there is considerable variability between HTA evaluations between countries, whereas the Common Technical Document (CTD) is generally acceptable with local modifications to all regulatory jurisdictions.

Figure 2: Main drivers for regulatory and HTA agency collaboration


The article also includes further findings, more detail in supplement materials and a comprehensive set of recommendations on how to improve synergy between agencies. Pop this publication on your reading list as you travel to your next meeting with a regulator or reimbursement agency.

Source of main photo: ‘Same Bed, Different Dreams’ South Korean TV show aired in Australia by SBS

Australian Public Hospitals and Activity-Based Funding

The National Health Reform Agreement (NHRA), signed by the Commonwealth Government and all states and territories in August 2011, committed to paying for public hospital expenditure, where practicable, using Activity-Based Funding (ABF), also known as Case mix or Episode-based funding.

ABF supports hospitals on the basis of the number, type and mix of patients treated. To ensure that payments are fair and equitable across public, private or not-for-profit providers of public hospital services, they are based on the same price for the same service.

Setting this price is the role of the Independent Hospital Pricing Authority (IHPA), established by the Commonwealth per Section B3 of the NHRA. Each year a National Efficient Price (NEP) is determined and used to calculate Commonwealth funding for public hospital services, and also to benchmark the efficient cost of providing those services.

The NEP is based on the average cost of an admitted acute episode of care provided in public
hospitals during a financial year. Each episode of patient care is allocated a National Weighted Activity Unit (NWAU). The episodes of acute care are coded using the Australian-Refined Diagnosis-Related Groups (AR-DRGs) classification system.

The NWAU is a measure of hospital activity expressed as a common unit. The ‘average’ hospital service is worth one NWAU. The price of each public hospital service is calculated by multiplying the NWAU allocated to that service by the NEP. The NEP for 2018-19 is $5,012 per NWAU.

The National Hospital Cost Data Collection (NHCDC) tabulates cost weights*, total number of separations, average length of stay and direct and indirect costs by AR-DRG. The most recent report available is for Round 20 (2015-16). The AIHW provides principal diagnosis AR-DRG data cubes up to, and including, 2016-17, although these do not include cost weights.

As diagnosis is a major driver of in-patient hospital costs, ABF for admitted acute care services is based on DRGs. Other hospital services: non-admitted out-patient care; admitted sub-acute & non-acute care; emergency department care; admitted mental health care; and teaching, training & research are costed using other information.  Excel-based NWAU calculators are available for some of these service streams.

*Note: NHCDC Cost Weights and NWAU should be identical for the same service within the same time period.

Cartoon source: http://www.sauer-thompson.com/archives/opinion/health/ [14 July 2018]

Data from Australian Hospitals

The Australian Institute of Health and Welfare (AIHW) recently released a number of  reports providing statistics on Australian hospitals.

Australia’s hospitals 2016-17 at a glance provides an overview of public and private hospitals and services provided to the Australian community. Companion hospital statistics reports present further detail on Hospital resources 2016-17Admitted patient care 2016-17 and Non-admitted patient care 2016-17.

The information in the reports is based on data provided to the AIHW by state and territory health authorities for the National minimum data set (NMDS). As the name implies, a NMDS is a minimum set of data elements agreed for mandatory collection and reporting at a national level. As such, a NMDS is dependent on a national agreement to collect and supply uniform data. 

The National Health Information Agreement (NHIA) is that agreement. The current NHIA between the Australian Government and state/territory government health authorities commenced in October 2013.  Established to coordinate health information in Australia, including national data standards, the agreement also includes a commitment to co-operate through the Australian Health Ministers’ Advisory Council (AHMAC) which is the advisory body to the COAG Health Council.

The description of the characteristics of data is called ‘metadata’, often said to be ‘data about data’. By allowing those collecting and using data to have a common understanding of underlying features, metadata leads to better data. The repository for Australian national metadata standards for the health, community services and housing assistance sectors was developed by the AIHW and is known as METeOR.

AIHW’s National Hospitals Data Collection is comprised of six major databases with acronyms to match! One such national data set is the National Hospital Morbidity Database (NHMD) which is the collection of electronic, confidential summary records for admitted patients from public and private hospitals in Australia each financial year from 1993-94 and ongoing.

An excellent service is the public availability of interactive cubes of data from the National Hospital Morbidity Database. For example, the principal diagnosis cube (most recent 2015-16 to 2016-17) includes information on the number of same day and overnight separations (discharges), patient days and average length of stay, by age group and sex and year of separation, for each diagnosis. It can take some trial and error to produce the information you are after in a suitable format, but well worth the effort.