Health Data Snapshot, Part 1

If you want to create a picture of the health status and needs of the residents in a particular Australian location, the first step is to define the area you are interested in. This seems pretty straightforward, until you start pulling out numbers…

Thanks to the Australian Bureau of Statistics, who developed the Australian Statistical Geography Standard (ASGS) in 1984, using the latest version from 2011, you can find statistics from different sources that apply to the same area, and hence, are comparable.  The power of this will become evident in Part 2, and saves a lot of time!

The ASGS is split into two parts. The basis for both are the smallest geographical area defined by the ABS, known as Mesh Blocks (MBs). They are geographic building blocks that take into account factors like suburb boundaries and land use. Most Mesh Blocks contain 30 to 60 homes. Mesh Blocks are updated every 5 years to reflect changes, such as new housing developments.

ABS Structures

These are areas that the ABS designs specifically for generating statistics. They also stay stable for 5 years to enable better comparison of data over time.

Statistical Areas Level 1 (SA1s) have an average population of approximately 400 persons. They aim to separate out areas with different geographic characteristics within Suburb and Locality boundaries. SA1s are aggregations of Mesh Blocks.

Statistical Area Level 2 (SA2s) reflect functional areas that represent a community that interacts together socially and economically. SA2s generally have an average population of about 10,000 persons. SA2s are aggregations of whole SA1s.

Statistical Areas Level 3 (SA3s) are designed for the output of regional data and generally have populations between 30,000 and 130,000 persons. SA3s are aggregations of whole SA2s.

Other classifications include SA4s for Labour Force Surveys; State and Territory and Australia for geographical purposes; and specific structures for Indigenous and Remoteness.


Non ABS Structures

As  the title would suggest, these are not defined by the ABS, however they are required to report statistics on them. These measures probably annoy purists within the ABS as they change regularly. For example, Local Government Areas (LGAs) are defined by State and Territory governments and updated annually. The diagram shows the eight Non-ABS structures that generally represent administrative regions and how the ABS approximates them using a construction of Mesh Blocks, SA1s or SA2s.

Diagram 2 depicts the various ASGS Non-ABS Strutcures, their component regions and how they interrelate.

In addition to Local Government Areas (LGAs), these include: Postal Areas (POAs); State Suburbs (SSCs); State Electoral Divisions (SEDs); and Commonwealth Electoral Divisions (CEDs), the later using the Australian Electoral Commission (AEC) federal electoral division boundaries constructed from allocations of one or more whole SA1s.

Non Non-ABS Structures

One to date: Primary Health Networks (PHN).

In Part 2, where and when to put these structures to use locating health data.

Visit the ABS website for further details. Photo source

Gut wrenching data

The newly released AIHW Report on Gastrointestinal Cancers is the first time Australia-wide data, specific to gastrointestinal-tract cancers, has been collated. It is the result of collaboration between the AIHW, all state and territory population-based cancer registries and Cancer Australia.

The report is a fantastic resource as it brings together epidemiological, diagnostic and treatment data in a comprehensive way thus providing a full picture for comparison and interpretation. The explanations regarding data sources in the appendices are also very helpful.

The eight upper and lower gastro-intestinal cancers included are shown in the graph below of cases diagnosed, deaths and relative 5-year survival rates.  Colorectal cancer is the most commonly diagnosed, a function of higher incidence and the National Bowel Cancer Screening Program (NBCSP), followed by pancreatic cancer as the second most commonly diagnosed.  These two cancer types are associated with the highest and lowest, 5-year relative survival rates of all gastrointestinal-tract cancers, at 69% and 9%, respectively.


The inclusion of disease Stage at diagnosis enables presentation of data as shown below from the report. Cases of colorectal cancer diagnosed in 2011 and the 5-year relative survival for the period 2011-2016, both reported by disease Stage, clearly demonstrate the impact of early diagnosis on mortality. For people diagnosed with Stage I colorectal cancer, the 5-year survival rate was 99%. Delay diagnosis to Stage IV and this figure becomes 13%.


In 2016–17, the gastrointestinal-tract accounted for approximately 20% of cancer diagnoses, 18% of cancer-related hospitalisations and 27% of chemotherapy procedures in Australia. Further detail on the treatment used at which disease Stage, would be a valuable inclusion in the next iteration of this report.

The majority (92%) of the burden of gastrointestinal-tract cancer was due to premature death. The remainder was associated with diagnosis (such as  biopsy) and primary treatment of the cancer (for example, surgery which may include bowel resection). Long-term effects, such as the use of a stoma with a colostomy bag, also contributes to the non-fatal burden from colorectal cancer in the Australian population.

Picture source: ‘The Scream’ original and stylised

Advanced Therapy Medicinal Products (ATMPs)

Advanced Therapy Medicinal Products (ATMPs) encompass gene, somatic cell therapies and tissue-engineered products, as well as these in combination with a medical device. Refer to  classification decision tree of AMTPs for further detail.

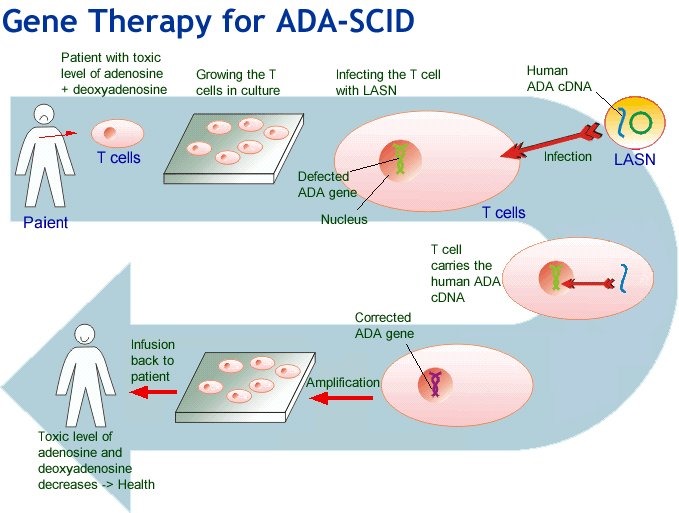
In general, these products involve replacement or regeneration of human cells, tissues or organs in the ultimate personalised medicine. Many also have the potential for a one-time cure. For example, GSK’s Strimvelis for treatment of adenosine deaminase deficiency–severe combined immunodeficiency (ADA–SCID), referred to as ‘bubble boy’ syndrome (below).

Regulation of ATMPs

The legal and regulatory framework for ATMPs in the European Union was formalised under Regulation (EC) No 1394/2007 over a decade ago. Since June 2009, the primary responsibility of the Committee for Advanced Therapies (CAT) is to assess the quality, safety and efficacy of ATMPs, and to follow scientific developments in the field on behalf of the European Medicines Agency. A summary of work to date is available in this presentation by the CAT Secretariat (May 2018).  New guidelines on GMP and GCP  for ATMPs have also been developed.

Meanwhile, the US FDA Center for Biologics Evaluation and Research (CBER) Office of Tissue and Advanced Therapies (OTAT, formerly known as the Office of Cellular, Tissue and Gene Therapies, or OCTGT) was renamed out of a restructure in 2016. In August 2017, the FDA Commissioner Scott Gottlieb, M.D. issued a statement on the agency’s new policy steps and enforcement efforts to ensure proper oversight of stem cell therapies and regenerative medicine. This has been followed by a further statement in July 2018 focused on gene therapies and ongoing releases of guidelines for consultation.

The International Pharmaceutical Regulators Forum’s (IPRF) currently has working groups for Gene Therapy and Cell Therapy to foster broad consultation and harmonisation. Identified challenges include the small quantities generated, often autologously, and short shelf-lives which do not fit with GMP principles. Similarly, without suitable animal models how is non-clinical testing to be performed, and does it need to be? Additionally, clinical trial design and data collection will require flexibility due to the rarity of most of the conditions being treated.

Reimbursement of ATMPs

In 2017, NICE commissioned a mock appraisal of ATMPs which concluded: ‘(1) the existing appraisal methods and decision framework were applicable to regenerative medicines; (2) quantification of decision uncertainty was key in decision-making; (3) where uncertainty is substantial, innovative payment mechanisms may play an important role and facilitate timely patient access; and (4) choice of discount rate is extremely important and can have an impact on the incremental cost-effectiveness ratio (ICER).‘ GSKs Strimvelis® received a positive NICE recommendation in October 2017 as an option for treating ADA–SCID when no suitable human leukocyte antigen-matched related stem cell donor is available. The cost at the time was Euro 594,000 (approximately AU$ 1 million) for the one-off treatment.

In a recent open access article, Jonsson and colleagues describe the convening of an Expert Panel to identify and discuss potential issues for ATMPs when evaluated using Health Technology Assessment (HTA) frameworks.  Identified challenges included clinical evidence generation, safety concerns, assessing and paying for value, uncertainty, affordability, and the manufacturing and organisation of service delivery. They prioritised three topics similar to those considered important by the NICE appraisal described above:

  1. Uncertainty – due to the nature of evidence likely to be available for ATMPs. Potential solutions posed include measuring survival separately for cured and non-cured patients. They reference an article by Othus et al. 2017  which uses this approach for ipilimumab in melanoma and reduces the ICER by a third. Collection of real world evidence and outcome based agreements, or leasing schemes are also discussed.
  2. Discounting – cost-effectiveness estimates for one-off treatments are sensitive to distribution of costs and benefits. ATMPs are likely to involve high treatment costs occurring years before all health benefits accrue, and it is this time period that is sensitive to discount rates and thus estimates of cost-effectiveness. They consider if specific discounting rules should apply to ATMPs reflecting on the opportunity cost of capital, time preference of stakeholders, and decreasing marginal utility of income and conclude that a lower discount rate should be used to support technologies with costs now and outcomes in the long-term, as well as benefiting future generations.
  3. Health outcomes and value when considering potential curative treatment for a few versus smaller incremental benefits for a much larger population. They discuss ‘priority setting’, how current HTA frameworks do not fully capture stakeholder values, QALYs and thresholds for decision making and limitations on how to account for other factors. They point out that ‘guidelines for reimbursement are silent about the role of empirical studies for assessing the value of specific products or classes of products from patients or the general public.’ Those who work in the HTA space know that other factors may also be relevant for payers, patients, and society in addition to health gain and health system costs.

The article concludes with recommendations as a means to initiate and continue discussion. Interestingly, the first four, of eight ATMPs currently EC-approved (ChondroCelect®, Glybera®, MACI®, Provenge®) have all been withdrawn from market for commercial reasons. After 15 years of research and development involving 500 patients, ChondroCelect® received marketing approval in the EU in 2009. It was voluntarily withdrawn by the sponsor in 2016.

The challenges faced by ATMPs include complex and expensive regulatory and manufacturing processes, small patient populations with limited clinical data, and the need for high upfront investment for a course of therapy that may only be a single treatment. As with current therapies for rare and ultra-rare diseases, how society can provide equitable patient access at the same time as commercial returns will be an ongoing debate.

Sources: AT-MP; Flow diagram

Visualisation of Health Expenditure data

The Australian Institute of Health and Welfare (AIHW) report on national health expenditure for the financial year 2016-17 was released last week. The usual on-line and pdf versions are available and the information can also be viewed using a data visualisation tool.

The tool accesses the AIHW Expenditure Database from 1996 through to 2016. Note: these years refer to financial years (the full year covered appears when the cursor is hovered over a data point on graphs produced).

The choice of presentation in constant or current dollars is important when assessing trends. Current prices are the actual amounts spent in the specified year. These will match the dollar amounts in the published reports, however they are not adjusted for inflation. Any comparisons made over different time periods require the use of constant prices that have been ‘deflated’ to a selected reference year. The tool uses the most recent data presented as the reference year. Growth in expenditure when expressed in constant prices is termed ‘real growth’ as opposed to ‘nominal growth’ when current prices are used.

There are 3 chart options: Total Health Expenditure (HE), Recurrent HE by Source of Funds and Recurrent HE by Area of Expenditure.

The Total HE option, as shown below, is limited to a comparison of fund source and area of expenditure by States/Territories.

Source of funds choices are Government (Australian or State/Territory and local) or non-Government (Health insurance, individuals or other).

Each of the five broad area of expenditures can be presented by (detailed areas of expenditure):

  1. Hospitals (Private or Public hospital services)
  2. Other services (Administration, Aids and appliances, Patient transport services)
  3. Primary health care (All other medications, Benefit-paid pharmaceuticals, Community health & other, Dental services, Other health practitioners, Public health, Unreferred medical services)
  4. Referred medical services
  5. Research

HE on Public Hospital services by the source of funds for NSW is shown above. Although the contribution of Private Health Insurance (PHI) as a proportion rose over 15% from 2012/13 (3.02%) to 2016/17 (3.48%), it is difficult to detect graphically as it is overwhelmed by the Government sources. Nationally, over the same period the proportion increased by approximately 9%.

Finally, HE by Area of Expenditure (above) provides a clear picture of the move of medication costs from Government to individuals over the past decade. Unfortunately, the variable labels continued to be truncated when the graph image was downloaded.

Overall, the data visualisation tool is a useful addition to the reporting of information by the AIHW.

Picture source and worth a read: https://www.mindjet.com/blog/2013/07/visualisation-rocks/

Additional article on data visualisations