

Visualisation of Health Expenditure data
The Australian Institute of Health and Welfare (AIHW) report on national health expenditure for the financial year 2016-17 was released last week. The usual on-line and pdf versions are available and the information can also be viewed using a data visualisation tool.
The tool accesses the AIHW Expenditure Database from 1996 through to 2016. Note: these years refer to financial years (the full year covered appears when the cursor is hovered over a data point on graphs produced).
The choice of presentation in constant or current dollars is important when assessing trends. Current prices are the actual amounts spent in the specified year. These will match the dollar amounts in the published reports, however they are not adjusted for inflation. Any comparisons made over different time periods require the use of constant prices that have been ‘deflated’ to a selected reference year. The tool uses the most recent data presented as the reference year. Growth in expenditure when expressed in constant prices is termed ‘real growth’ as opposed to ‘nominal growth’ when current prices are used.
There are 3 chart options: Total Health Expenditure (HE), Recurrent HE by Source of Funds and Recurrent HE by Area of Expenditure.
The Total HE option, as shown below, is limited to a comparison of fund source and area of expenditure by States/Territories.
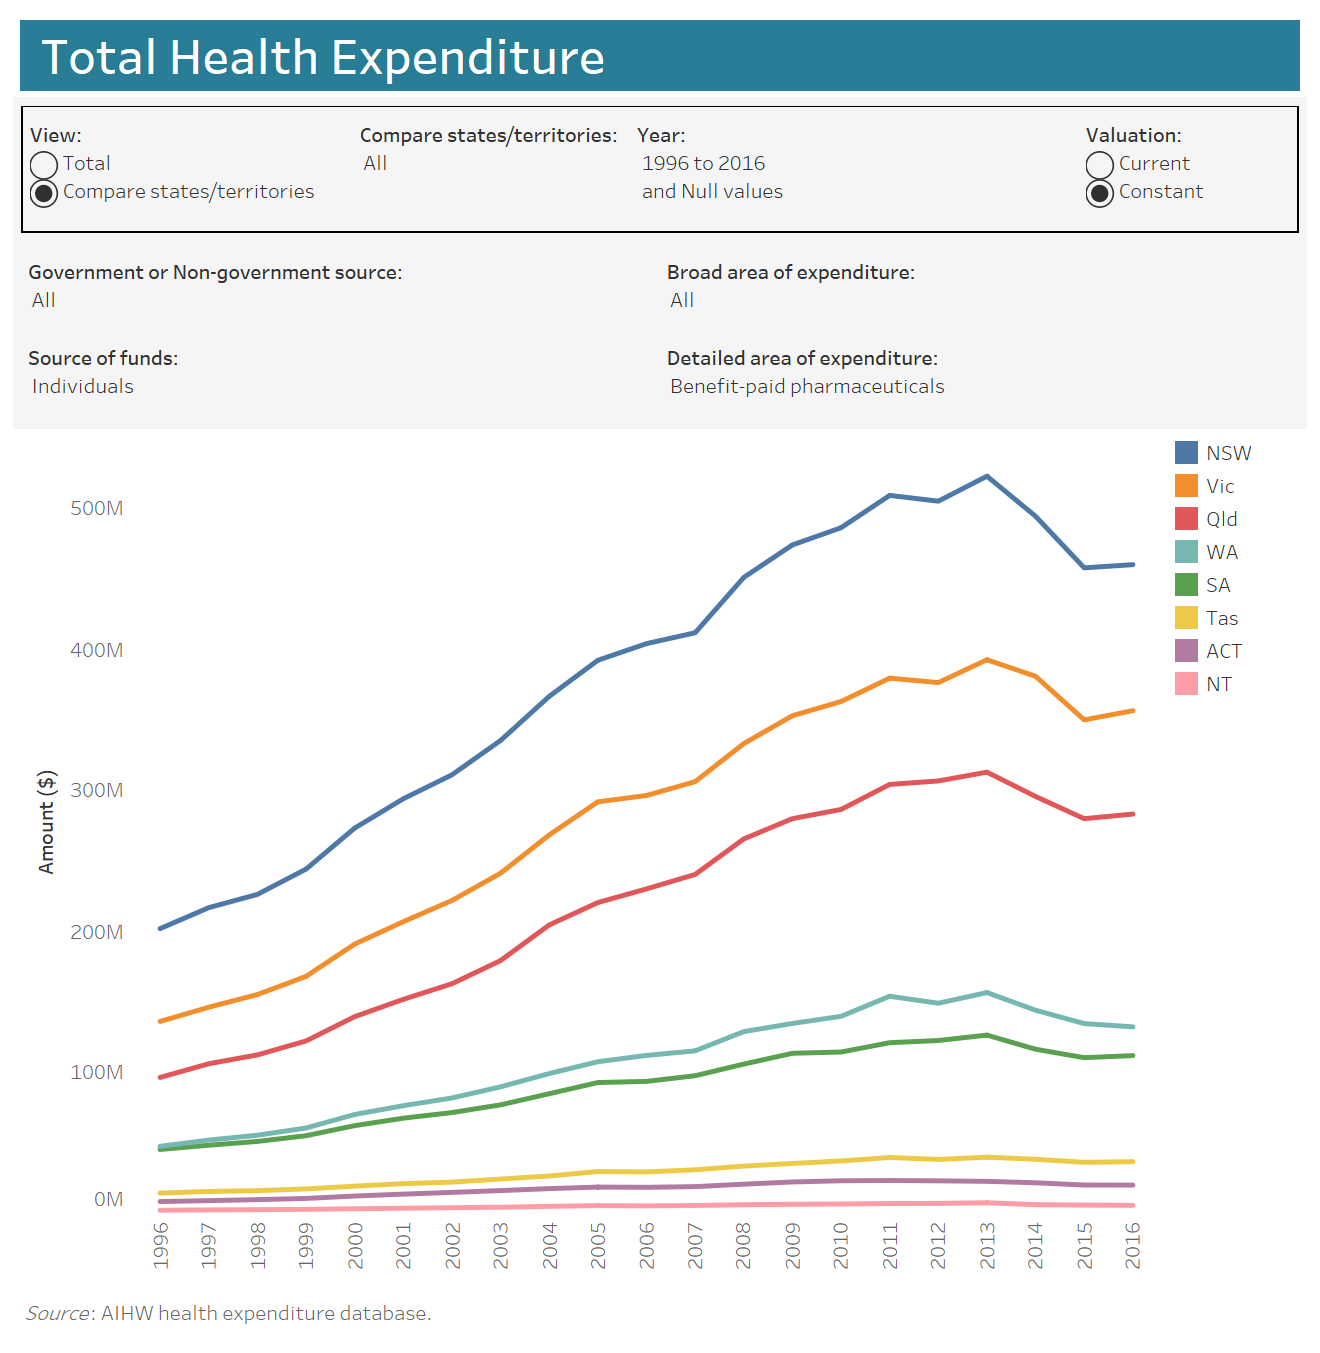
Source of funds choices are Government (Australian or State/Territory and local) or non-Government (Health insurance, individuals or other).
Each of the five broad area of expenditures can be presented by (detailed areas of expenditure):
- Hospitals (Private or Public hospital services)
- Other services (Administration, Aids and appliances, Patient transport services)
- Primary health care (All other medications, Benefit-paid pharmaceuticals, Community health & other, Dental services, Other health practitioners, Public health, Unreferred medical services)
- Referred medical services
- Research
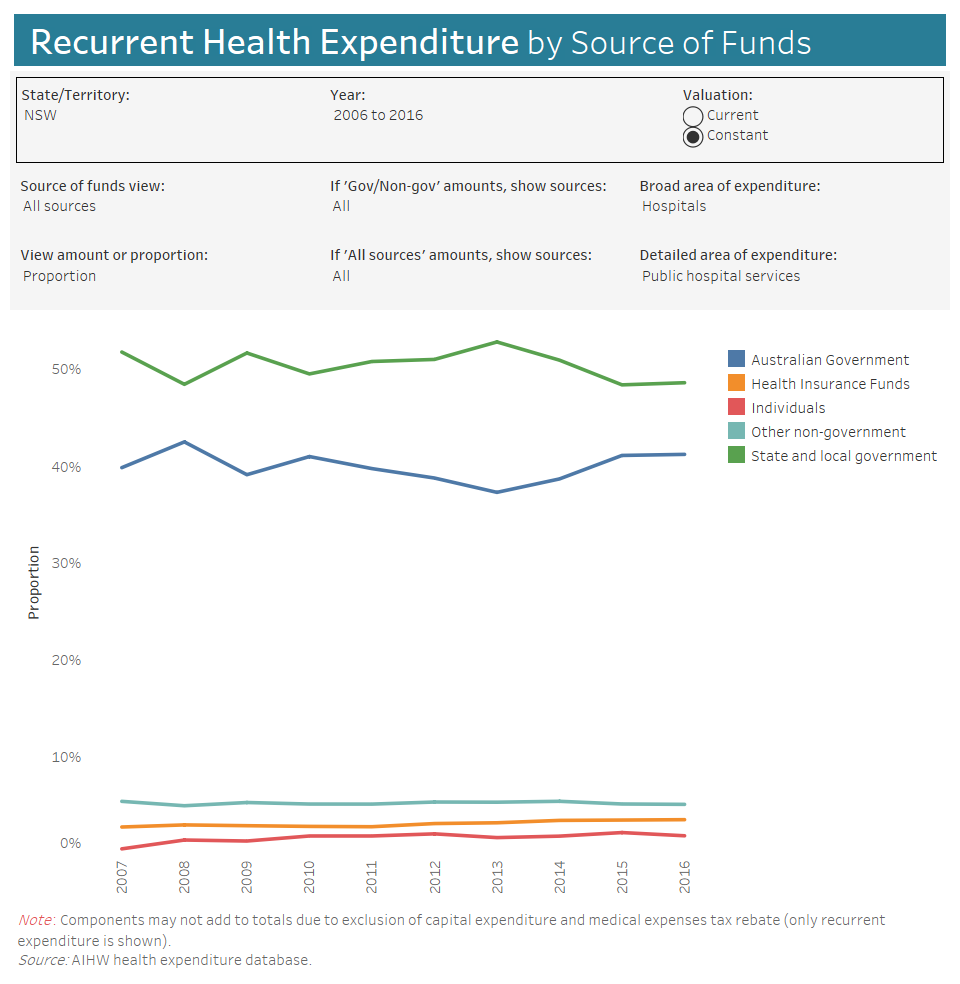
HE on Public Hospital services by the source of funds for NSW is shown above. Although the contribution of Private Health Insurance (PHI) as a proportion rose over 15% from 2012/13 (3.02%) to 2016/17 (3.48%), it is difficult to detect graphically as it is overwhelmed by the Government sources. Nationally, over the same period the proportion increased by approximately 9%.
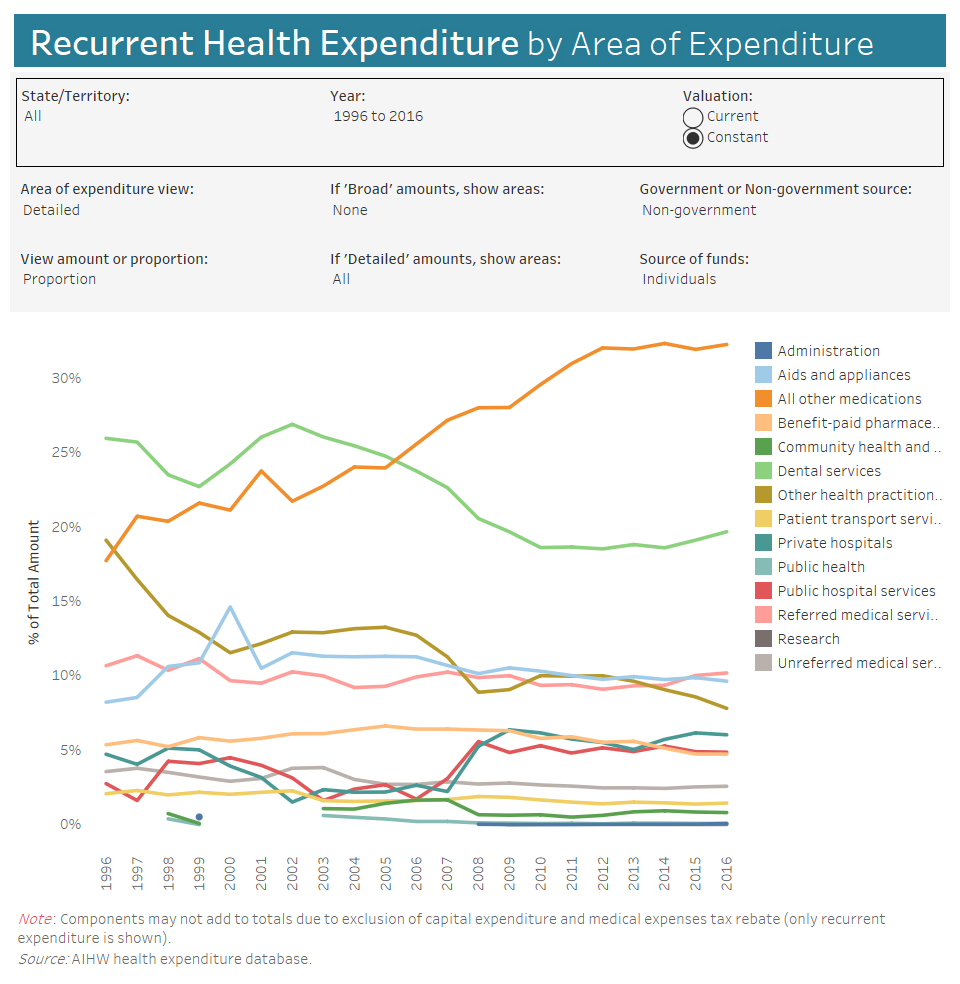
Finally, HE by Area of Expenditure (above) provides a clear picture of the move of medication costs from Government to individuals over the past decade. Unfortunately, the variable labels continued to be truncated when the graph image was downloaded.
Overall, the data visualisation tool is a useful addition to the reporting of information by the AIHW.
Picture source and worth a read: https://www.mindjet.com/blog/2013/07/visualisation-rocks/

