
Who is subsidising who?
Over 30% of all prescriptions written in Australia for PBS-listed medicines are self-funded as they cost less than the relevant Co-payment (under co-pay).
General patients (co-pay $40.30, 1 Jan 2019) are the sole recipients of this cost-shifting as the dispensing fee ($7.29) is greater than the Concessional co-pay amount ($6.50).
So why do the 8% of Services to General patients account for over 30% of Government PBS/RPBS expenditure?
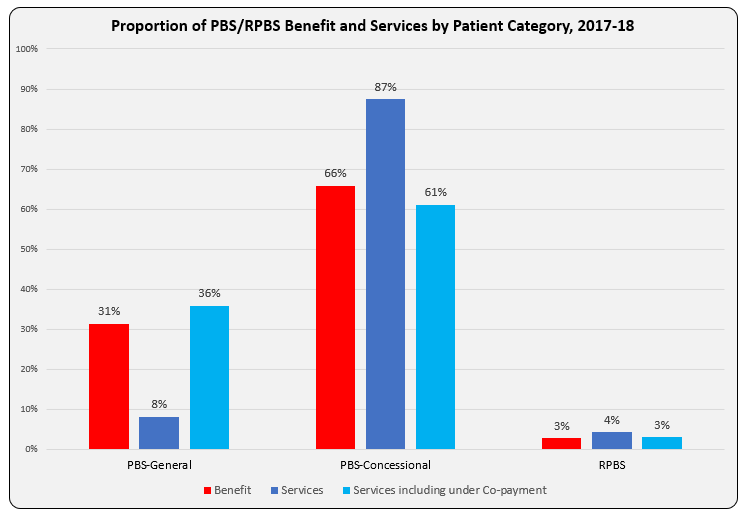
The bar graph shows Benefit paid and differences in proportion of Services attributable to patient categories with and without inclusion of under co-payment numbers. Another way to present this, and as reported in the annual PBS expenditure & prescription tables, is as Average Government Benefit paid per Service.
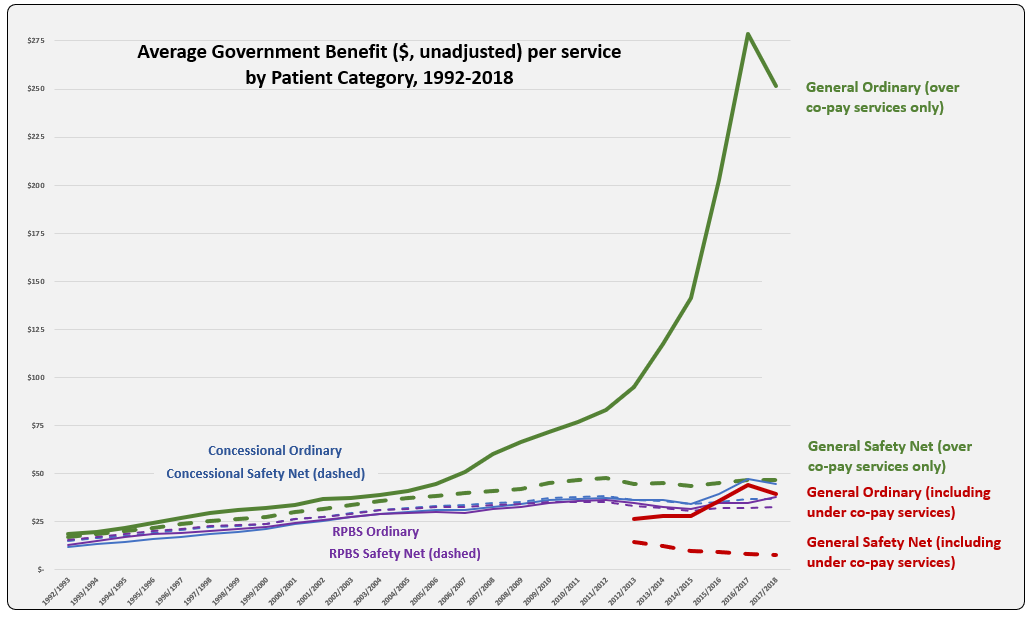
The line graph shows the evolution of Average Benefit per Service by patient category over time. This graph is based on figures downloaded from Medicare Australia website (includes both Section 85 & Section 100). The total services (approximately 205 K) match the prescription numbers presented in the PBS Expenditure and Prescription Report for the same periods, which exclude under-co payment prescriptions (since reporting started in 2012-13).
Why is the Average Benefit per Service currently over five times higher for the General patient category compared to Concessional?
Is there a difference in the demographics of General and Concessional patients such that higher cost (F1) medicines are prescribed more frequently to General category patients?
| Benefit paid per service ($) by ATC | CV | CNS | Anti-Infectives | GI | Respiratory | Oncology-Immuno | Other |
| 2017/2018 | $ 15.24 | $ 28.65 | $ 149.68 | $ 31.64 | $ 46.16 | $ 966.48 | $ 62.98 |
In recent years, the peak and drop for average benefit paid per service for the General ordinary category mimics that of usage of new Hepatitis C treatments. Is there disproportionate prescribing of these and other higher cost drugs, such as oncologics and immunomodulators, between categories? To test this, benefit figures were downloaded from the Medicare Australia website for Hepatitis C medicines and reveal a split between General and Concessional patient categories of 39% to 61% in $1.37 billion paid by Government during 2017-18. Total service numbers (72,266) show a similar ratio with General 37% and Concessional 63%. For the ImmunOncology medicine, Nivolumab (Opdivo, BMS) total services (40,560) were split General 32% to Concessional 65% in 2017-18.
Perhaps the cause is an artefact of the huge volume, relative to General patients, of low cost (F2) items prescribed, and paid by Government for Concessional patients? Rosuvastatin and Atorvastatin had the highest prescription volumes in 2017-18, of these 37% and 30%, respectively were under co-payment prescriptions.
As a proportion of over co-payment prescriptions in 2017-18, Safety Net (SN) accounted for by 1.3% of the General patient category and 18.2% Concessional. The addition of approximately $40 and $6.50, respectively per script to Government expenditure is unlikely to be responsible for the large difference in average benefit per service paid, given the General SN category is so small.
Suggestions on what may be driving this difference are welcome. Hope you can provide me with a D’oh moment!
Sources: Simpsons; Medicare Australia Statistics; PBS expenditure prescriptions report tables

