PBS structural change
The long-term impact of 2007 PBS reforms are clearly evident when comparing patient categories by proportion of services and benefits. The introduction of separate formularies for single (F1) and multiple brand (F2) drugs plus successive price disclosure initiatives have fundamentally altered the structure of the Australian Pharmaceutical Benefits Scheme.
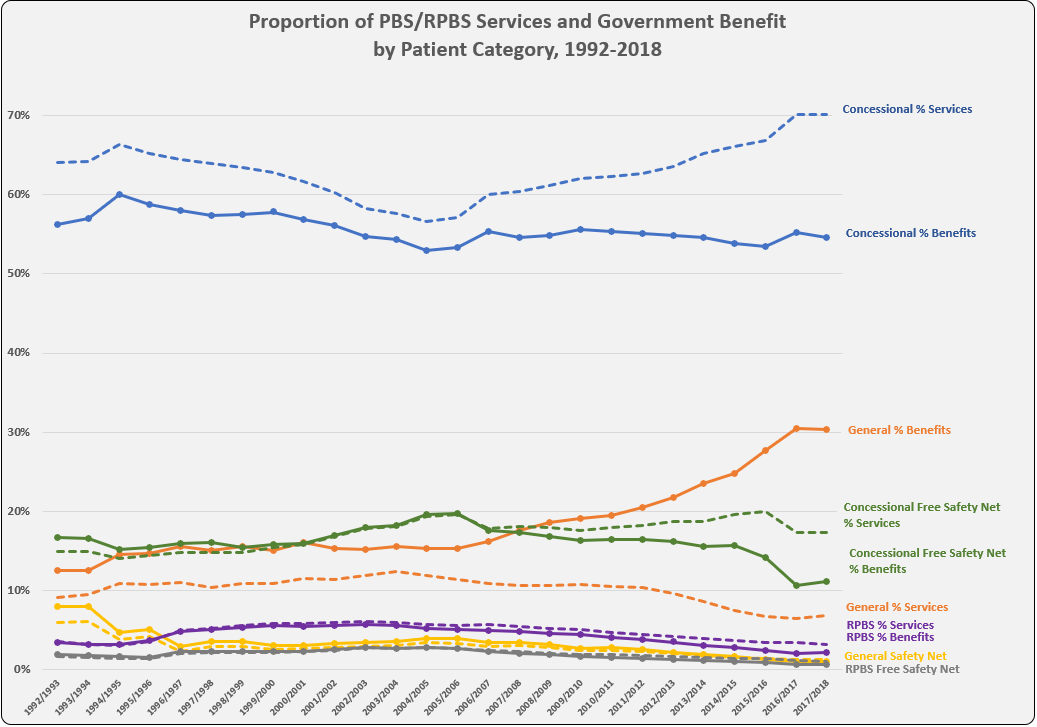
Despite ongoing increases in Concessional ordinary category (patient co-payment $6.50 in 2019) services (blue dashed line on graph), the cost paid/subsidised by Government (benefits, blue) has remained flat. Once a patient has paid $390 (60 items), the remaining services for the calendar year are provided free (Concessional Safety Net in green). Since the reforms the trend has been flat or downward, with recent significant drops most likely due to the $1 discount and other dampening policies on qualification.
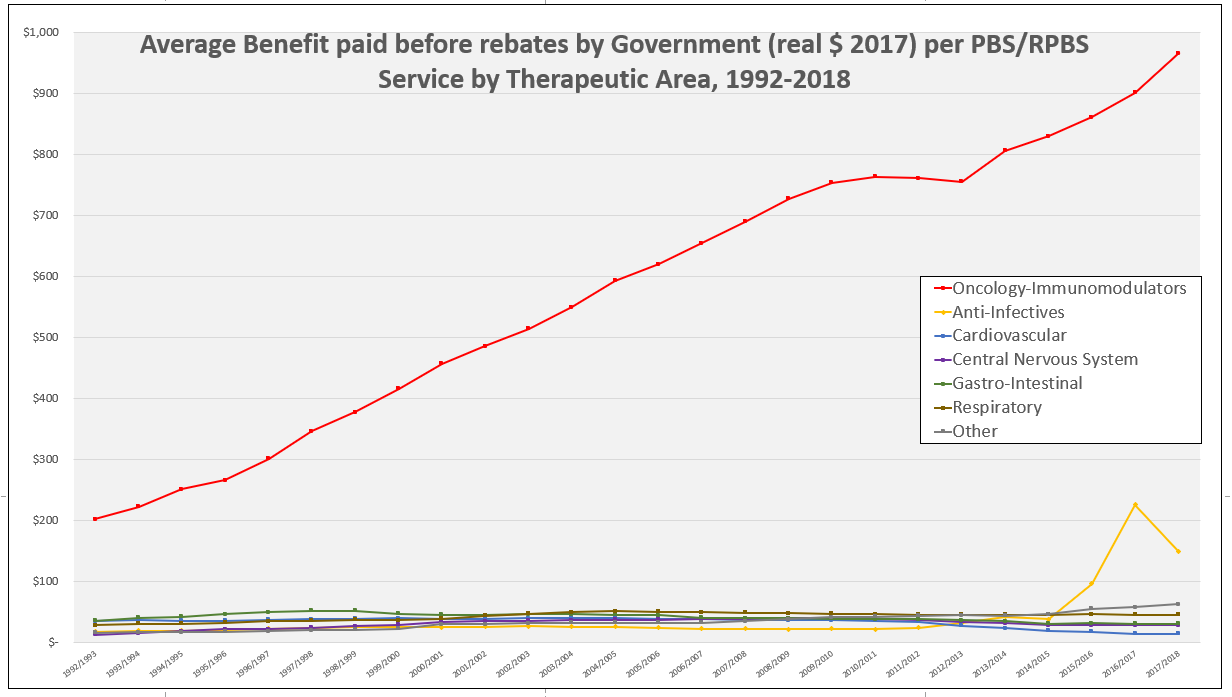
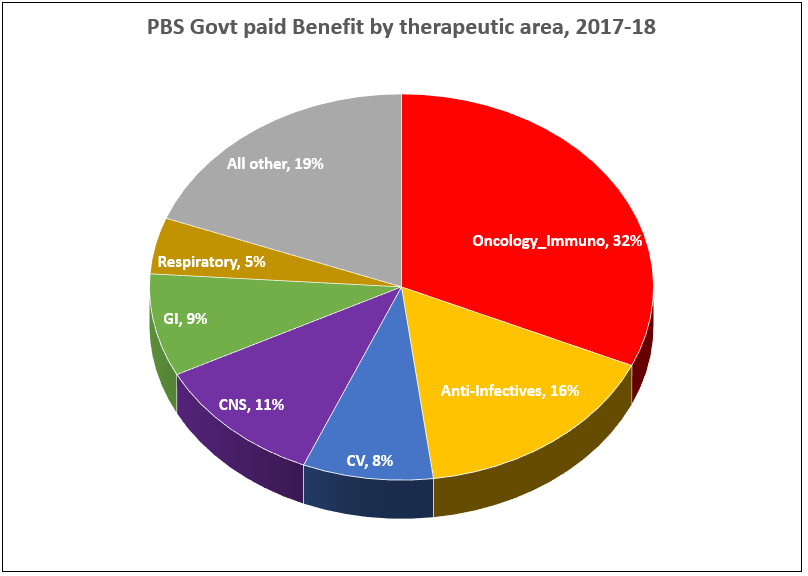
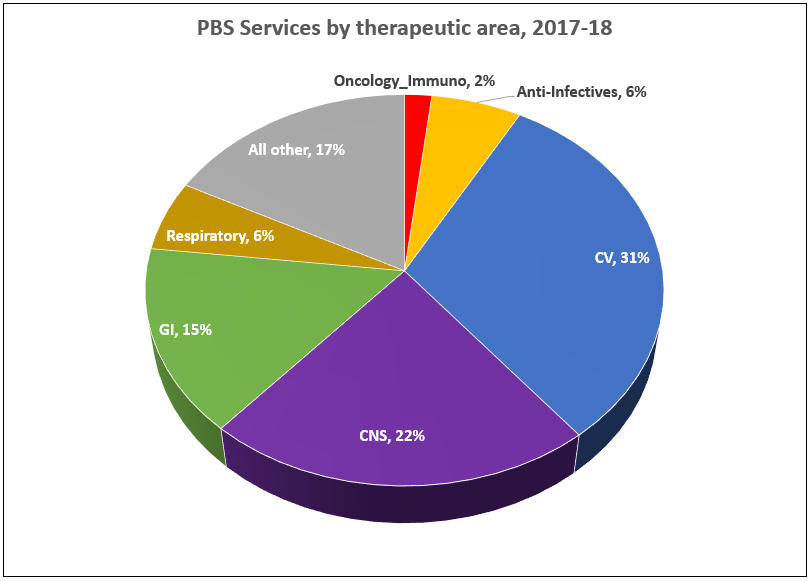
While General category (co-payment $40.30 in 2019, shown in orange) services as a proportion of total has dropped away since the reforms, benefits paid by the Government for General patients (orange solid line) has almost doubled to account for 30% of total benefits in 2017-18. This is counter-intuitive as there are an increasing number of PBS items below co-payment and paid 100% out-of-pocket by patients. It is likely a consequence of the type and cost of medicines over the co-payment (refer earlier post PBS by therapeutic area showing increasing benefits paid for Oncology, Immunomodulators and Anti-infectives (Hep C) medicines).
The reducing service numbers in the General category (orange dashed) are influenced by the of loss of exclusivity on molecules with high prescription volumes and subsequent price disclosure. A similar dampening effect on the Safety net qualification is also obvious over time.
Notes:
Patient category refers to a patient’s eligibility status at the time of supply of a PBS or RPBS pharmaceutical benefit. Concessions are available to Centrelink issued Pensioner Concession Card, Commonwealth Seniors Health Card and Health Care Card holders; as well as those with a Department of Veteran Affairs White, Gold, or Orange Card. General benefits apply if you do not have any of these cards. Further details are available on the PBS and DVA websites.
PBS Patient Category reports are available on the Government data.gov.au website as annual excel workbooks with month by month breakdown for the time period 1992 to 2016. Downloading directly from Medicare Statistics website is also possible for the period 1992 to current.