PBS rewards innovation?
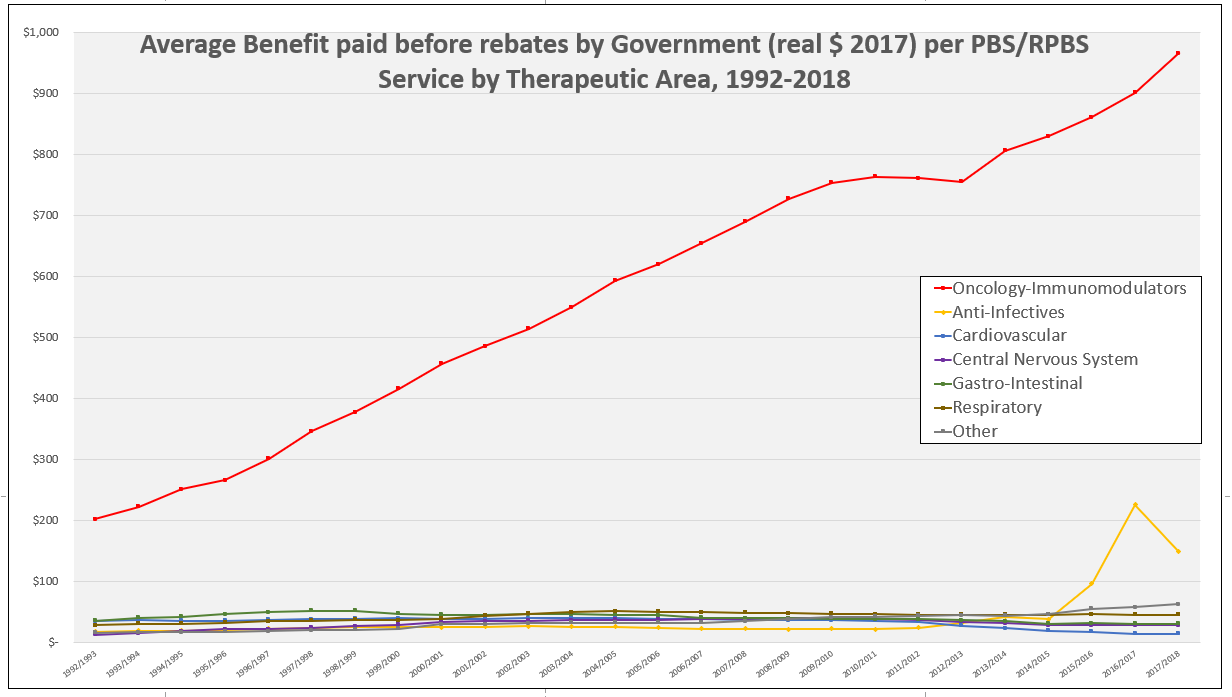
Last financial year (2017-18) the average benefit paid by the Australian Government per subsidised PBS/RPBS service was approximately AU $60 (1). However, separation of payments by therapeutic area (see graph) reveals a startling two-tier PBS with the majority of areas experiencing little growth in benefit paid since 1992-93, contrasted by those with consistent or dramatic spikes in growth.
How might this be interpreted?

One possibility is that, based on published list prices, the PBS/RPBS is rewarding innovation. The steady climb in benefit paid per service for Oncology-Immunological agents reflecting the ongoing innovation in this sector, with the consistent introduction of new, more cost-effective therapies.
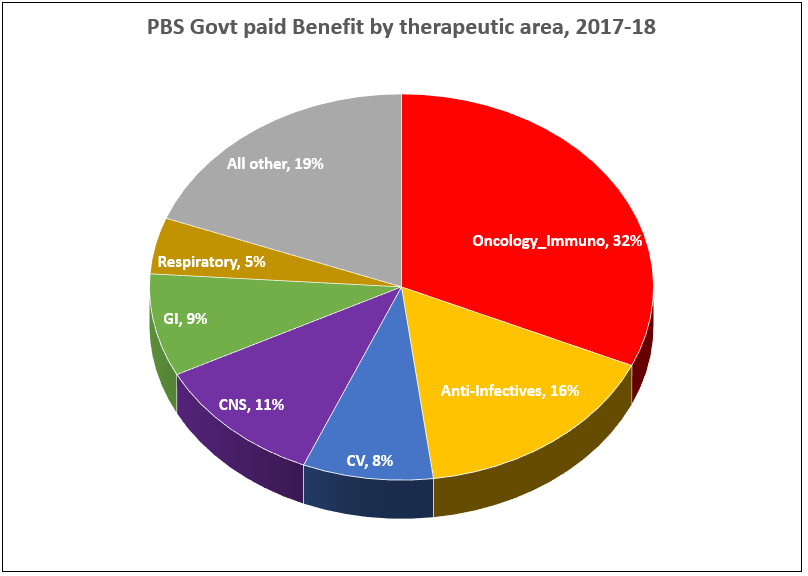
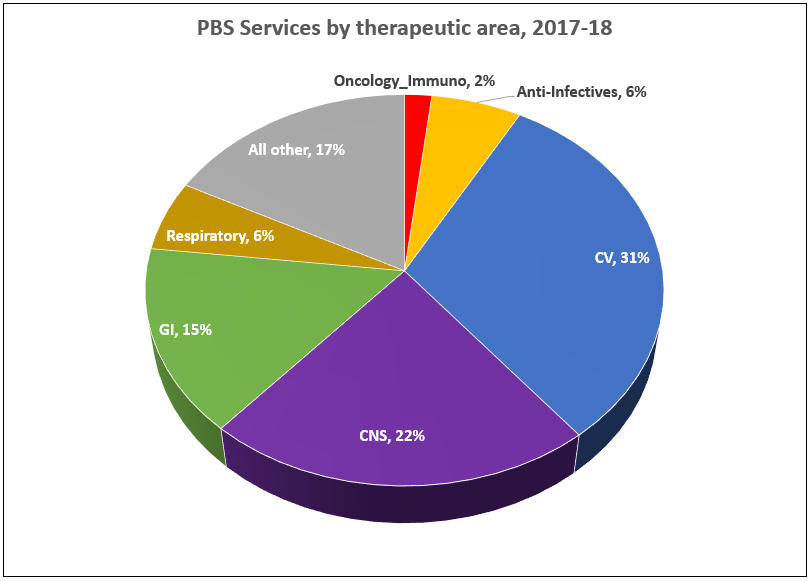
The average benefit paid in 1992-93 for these drugs was $202.24 per service (in real 2017 dollars) representing approximately 3% of total cost to Government. In 2017-18, this had risen to $966.48 per service and Oncology-Immunology accounted for 32% of total Government cost of the PBS, but only 2% of total services. Specialists and patients in other therapeutic areas could question how representative this is.
In 2016-17, anti-infectives accounted for over 25% of all benefits paid by Government coinciding with peak uptake of newly listed Hepatitis C treatments. Although given the magnitude of rebates required in this area, revealed by a now-withdrawn poster, this information should only be considered guidance to trends.


The impact of price disclosure on benefit paid is clearly illustrated by the Cardiovascular (CV) therapeutic area. Over the 26-year period graphed, services as a proportion of all PBS activity have increased from 22% to 31%. Meanwhile, in 1992-93 the average benefit paid by Government per service was $35.39, peaking at $40.99 in 2003-04, and dropping to $15.24 in 2017-18 where CV medicines account for only 8% of benefits paid.
In terms of proportions, CNS medicines have remained relatively stable over the time period: 18% in 1992-93 to 22% in 2017-18 of services; 10% and 11%, respectively for benefits.
Gastro-Intestinal medicines have experienced a similar trend with an increase in proportion of services from 11% to 15%, while the benefit dropped overtime from 16% to 9%. This is most likely a reflection of the continuing prescribing of PPIs, and their loss of patent exclusivity.
The Respiratory therapeutic area has experienced a decrease in both the proportion of services (10% to 6%) and benefit (12% to 5%). A look at raw numbers of services shows a slight increase from 11.4 to 12 million over the period.
Methodology:
PBS/RPBS data downloaded from the Medicare Australia Statistics website for the period 1992 through 2018 was analysed by therapeutic area. The Anatomical Therapeutic Chemical (ATC) classification system, as recommended by the World Health Organisation (WHO) for drug utilisation monitoring and research (WHO 2019 Guidelines), was used. Benefit and service data was collated separately and then used to calculate the average Government benefit paid ($) per service by therapeutic area. Adjusting the benefit to adjust for inflation into real 2017 dollars did not alter the trends.
References: (1) http://www.pbs.gov.au/info/statistics/expenditure-prescriptions/expenditure-prescriptions-twelve-months-to-30-june-2018
Image source: http://cancer.nautil.us/article/196/why-cancer-drug-prices-keep-rising-in-the- us


