Is that drug listed on the Pharmaceutical Benefits Scheme? NSW Cancer Conference 2023 Poster #186
https://tacshealthcare.com.au/wp-content/uploads/2023/11/NSW-CC-Sep-2023-Poster-186.pdf
Objective
As one of the three pillars of Australia’s universal public health system, the Pharmaceutical Benefits Scheme (PBS) provides equitable access to medicines for all Australians. Cancer is a leading cause of death of Australians (18% in 2020).1 Hence, timely availability of new treatments on the PBS has become more critical than ever.
This retrospective review of the listing and use of cancer pharmacotherapies on the PBS considers whether the current scheme is meeting the needs of Australian medical oncologists, haematologists and their patients.
Methods
PBS and Repatriation PBS (RPBS) claims data for all funded programs, including chemotherapy, were sourced from the Services Australia 2 and PBS3 websites. Services (prescription dispensed for a PBS item) for and benefit statistics were graphed by Anatomical Therapeutic Chemical (ATC) first level code over time. Proportions of Government expenditure and average cost per service were calculated.
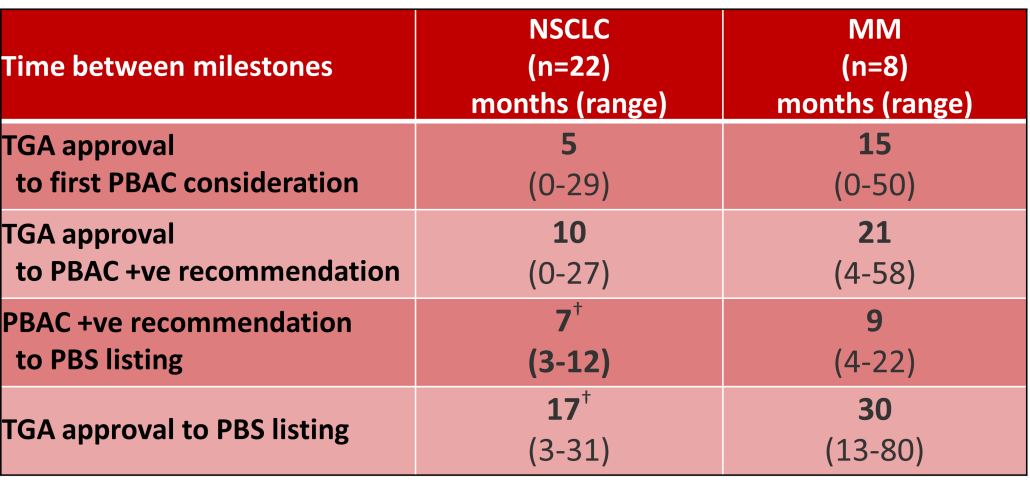
Outcomes of Pharmaceutical Benefits Advisory Committee (PBAC) Meetings4 were reviewed to identify considerations for the first indication of new products for non-small cell lung cancer (NSCLC) and Multiple Myeloma (MM), as representative of pharmacological treatments for solid tumour and haematology indications. The duration between marketing approval by the Therapeutic Goods Administration (TGA) and time points to PBS listing were determined.5
Results
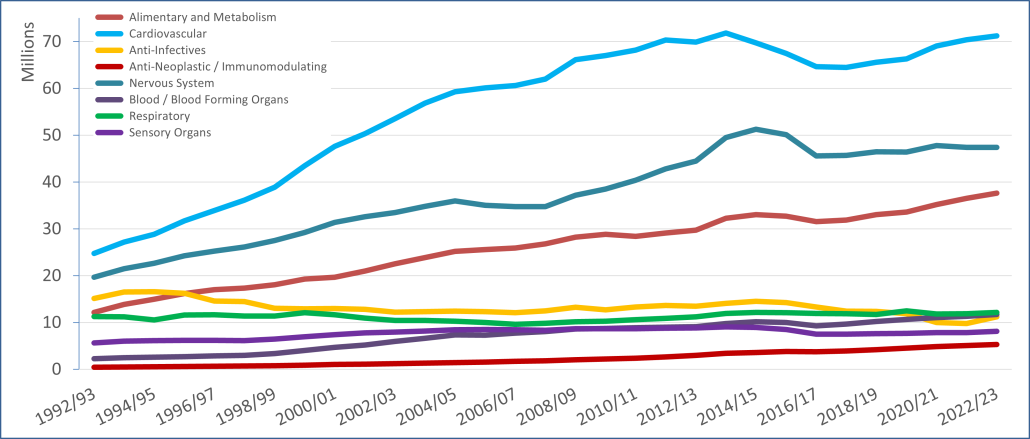
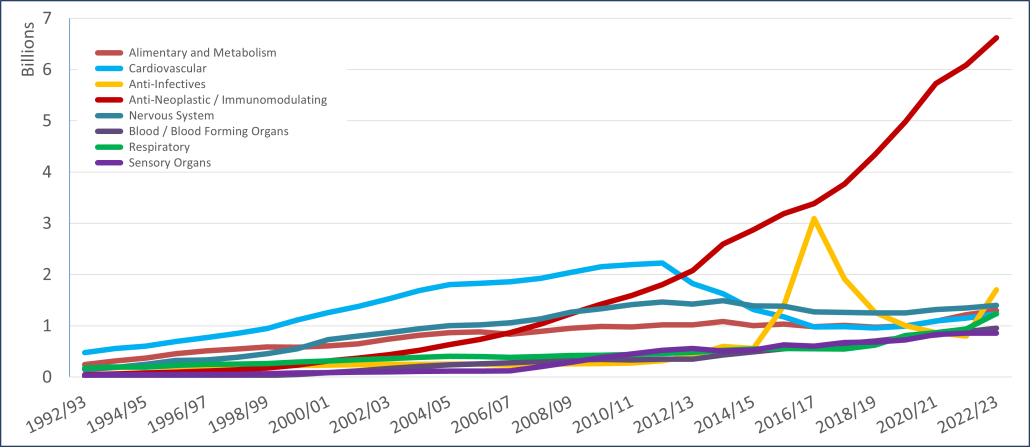
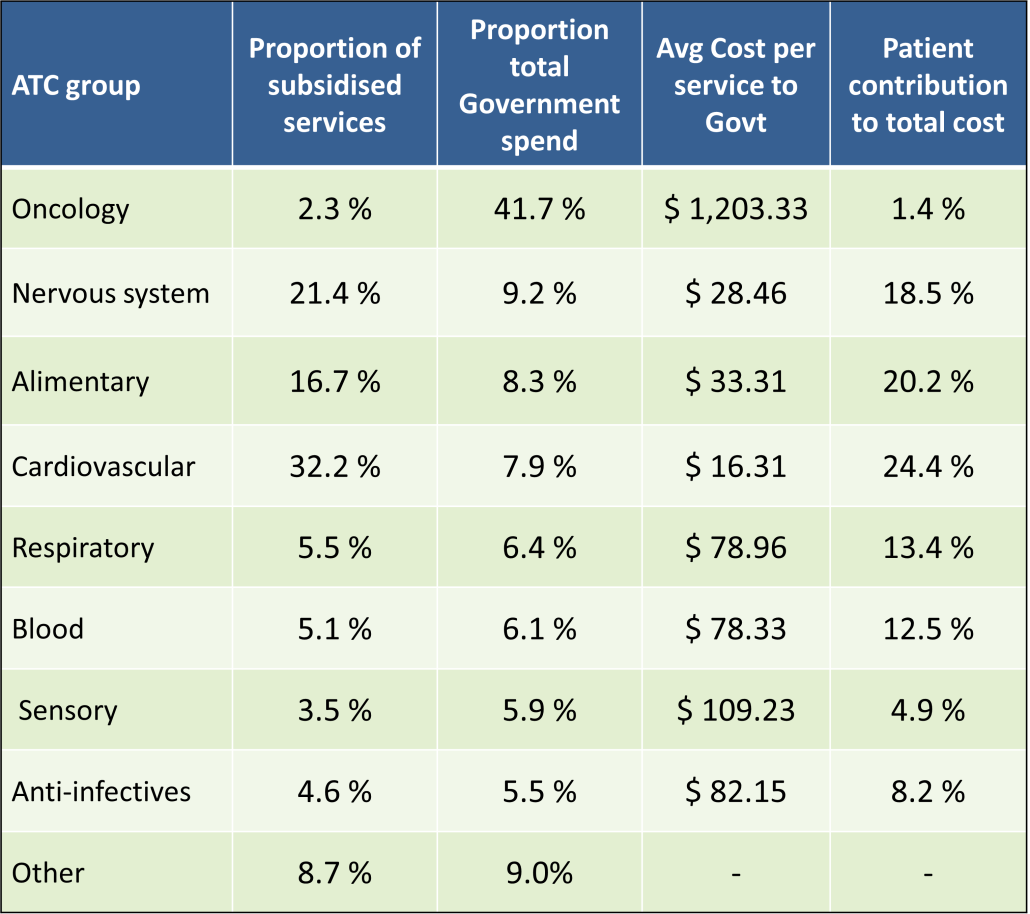
PBS/RPBS claims data was available by ATC for the 31-year period 1992/93 to 2022/23. Changes in the number of services provided and benefit paid by the Federal Government (excluding patient co-payments) for ATC groups contributing over 5% are shown in Figures 1 and 2. Table 1 provides cost breakdowns by ATC, including patient out of pocket contributions.
All ATC groups grew over time mirroring societal demographic changes. The higher growth of Cardiovascular, Nervous System and Alimentary groups reflect treatment innovations with statins, anti-depressants and proton-pump inhibitors, respectively.
The introduction of Section 100 High-Cost Drugs to reimburse States for in-hospital usage of certain therapies, and agreements between the Commonwealth and all States/Territories, except NSW/ACT, to permit PBS out-patient dispensing have also added service volume to the scheme. Increased costs have been offset by pricing policy changes, mostly directed at manufacturers, such as splitting into Formularies by molecule patent status, Price Disclosure and Efficient Funding of Chemotherapies (EFC).
While the proportion of total services for cancer treatments grew over time, the ATC group represented only 2.3% of PBS/RPBS activity in 2021/22. However, in the same year, the group represented 41.5% of total Government expenditure on the PBS/RPBS program and continuing to grow.
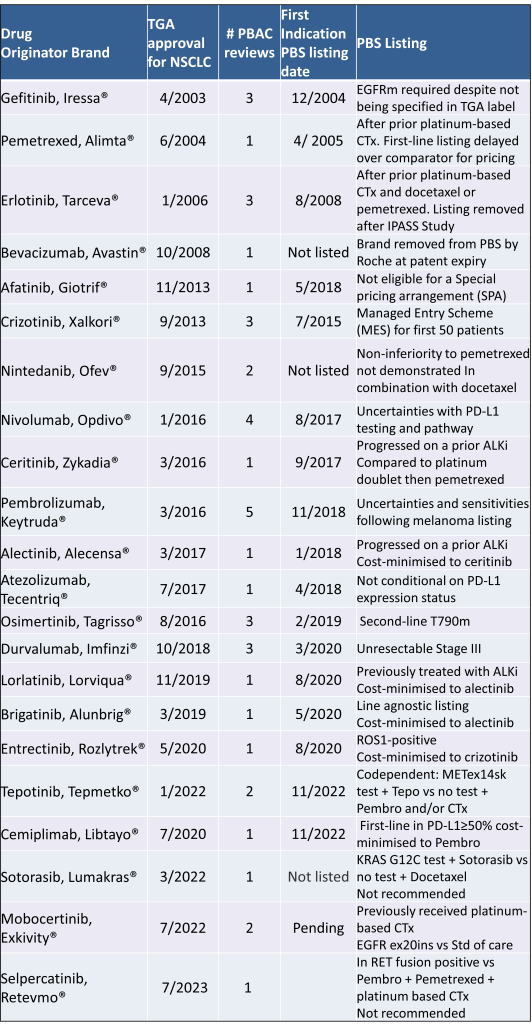
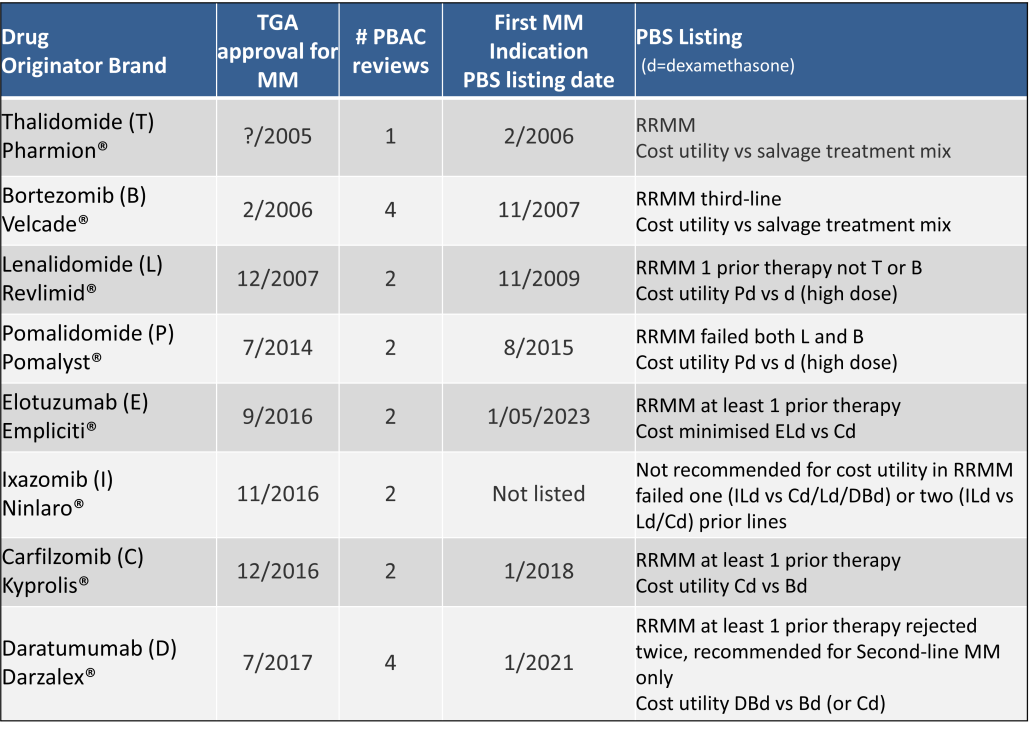
Table 2 lists new medicines requesting PBS listing for a NSCLC indication, and Table 3 for Multiple Myeloma from PBAC Meeting outcome documents available from December 1999. Public Summary Documents were introduced from July 2005. The number of PBAC considerations and date of TGA approval and PBS listing are noted.
Discussion
Innovative medicines are now considered by the PBAC at similar times to TGA approval due to policies such as Parallel Processing and TGA Provisional pathways. Streamlining of PBS processes in the past 5 years see clinically effective drugs navigating the process usually within two PBAC considerations. Beyond this, intractable issues can introduce a significant lag between local treatment practices and internationally accepted standards of care.
The finding that there was an average 13-month difference in time to access new treatments for MM and NSCLC on the PBS over the period supports ongoing policy reform to accelerate access.
Conclusions
•Although variable time to access, the PBS/RPBS is serving patients with cancer, and their clinicians by subsidising innovative treatments.
•Treatments for cancer account for an increasing proportion of total Government expenditure on the scheme. Currently, over 40% and growing.
•Although the proportion of patient out-of-pocket costs are comparatively low, the actual amount can be significant and inequitable relative to other therapeutic areas.
