The State of Play
At the time of federation in 1901, health was not a public policy topic. The new Australian Constitution granted the Commonwealth responsibility for quarantine, under s 51(ix) and for ‘invalid and old age pensions’ under s 51(xxiii). However, by 1945 the situation had changed, with health firmly on the political agenda. Consolidation of the welfare state principle in most democracies, galvanised by the suffering and sacrifice of WWII, created governments compelled to provide basic care for all their residents.
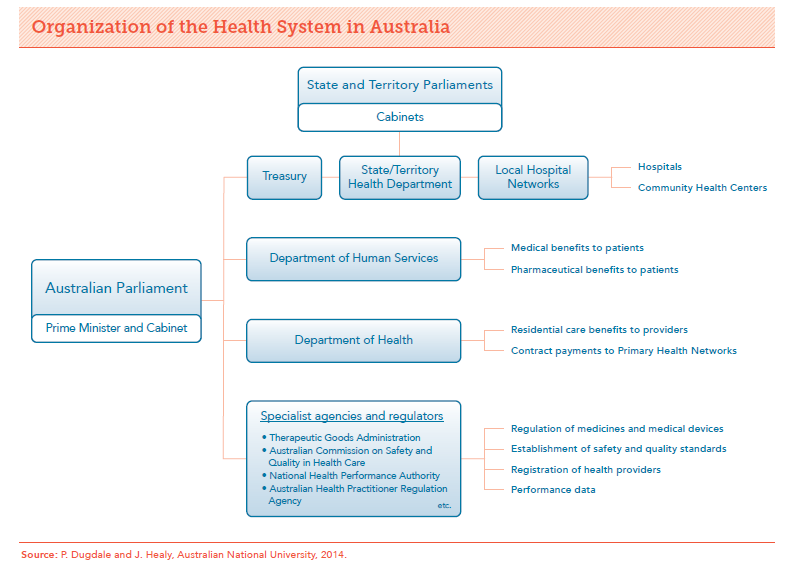
In 1946, the Constitution was amended granting the Commonwealth power to make laws with respect to health among others (1). Under s 51(xxiiiA), the Federal Government assumed power over social services, including ‘pharmaceutical, sickness and hospital benefits, medical and dental services (but not do as to authorize any form of civil conscription)’ (2). The various Acts that followed established the Australian health care system of today.
The states have power over hospitals and other services without the financial resources to fully fund those services, whilst the Commonwealth has funding capacity unmatched by the power to regulate the services it finances.’ Wheeler 1995
‘These divisions render coherent policy making, even at the state level, almost impossible.’ Duckett2004

The Commonwealth is financially the prevailing force, receiving over 80% of all tax revenues collected in Australia (State and local government taxes and levies accounted for the other).
Looking at New South Wales (NSW), in addition to the revenues it collects, the state receives grant revenue from the Commonwealth Government (including GST payments, National Agreements and National Partnerships) forecast to be around $32.5 billion in 2018-19, out of total state revenue of approximately $80 billion.
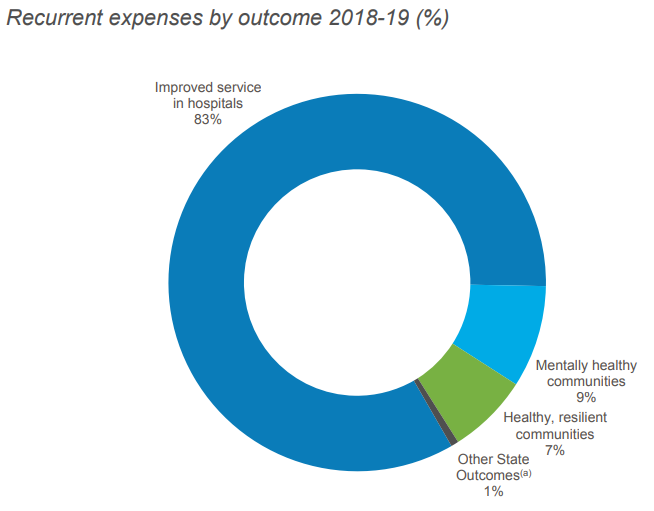
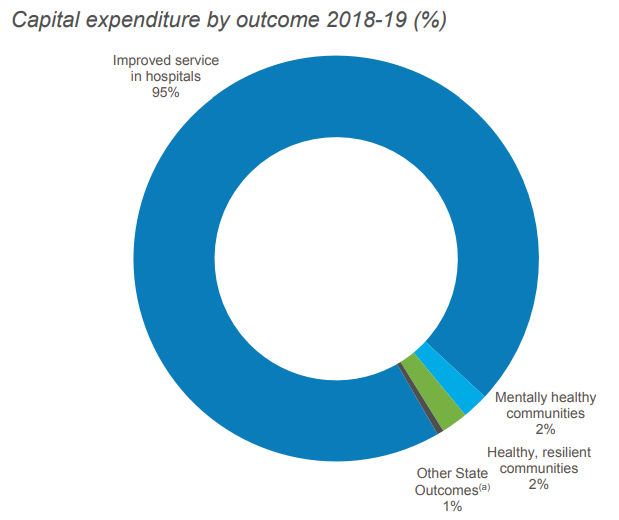
Health (28.6%, $22.9 billion) is the largest Recurrent Expenditure group for the NSW Government in 2018-19. This is not the case with Capital Expenditure with transport representing 56.5%, and health a distant second at 12.5%. Those stadiums don’t rate costing only 2.2 billion!
The charts below relate specifically to the NSW Health Budget showing the proportion of spend by anticipated outcomes. Hospitals predominate in both. In yesterday’s state election, the incumbent’s campaign claimed to have invested nearly $10 billion in health infrastructure since coming to office in 2011, with another $8 billion committed over the next four years.


Notes:
(1) Other sources of Commonwealth power include: s 96 (the power to make special purpose grants); ‘insurance’ (s 51(xiv)), the corporations power (s 51(xx)); the defence power (s 51(vi)); and, as amended by the referendum of 1967, s 51(xxvi) which empowers the Commonwealth to make laws for the benefit of Indigenous Australians’. Griffith 2006
(2) This conscription statement is the origin of the differences between Federal Government payment systems for PBS and MBS.
References available on request.


