
Health Data Snapshot, Part 2
In Part 1, geographical classifications available for collation and reporting of health data were discussed.
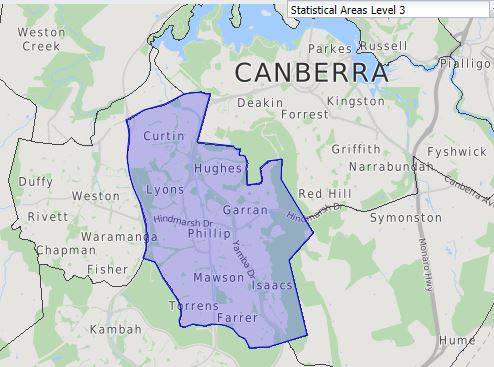
The demographic characteristics of a population are generally presented before moving into health statistics. The ABS Census of Population and Housing Data includes this information and is available by geography online for the past 4 surveys (2016, 2011, 2006, 2001). The 2016 Census for ABS Statistical Area 3 for Woden Valley in Canberra, Australian Capital Territory (ACT), the location of the Department of Health is shown. ‘Quick Statistics’ provide a one page (scroll down) summary for the approximately 35,000 residents in a table format, and a side by side comparison of each variable to that recorded for the 400,000 inhabitants of the ACT, and just over 24 million people in Australia. While 68% of the residents of the Woden Valley were born in Australia, 25% speak a language other than English at home.
A ‘General Community Profile’ is also generated and consists of an Excel workbook containing 60 spreadsheets of data for the area selected. A range of other Census data products are also free online, including Time Series Profiles across Censuses, DataPacks and TableBuilders.
The 5-yearly Census of Population and Housing data is used to generate the Socio-Economic Indexes for Areas (SEIFAs) which, as the name implies, rank areas in Australia according to relative socio-economic advantage and disadvantage. Each of the four indexes is a summary of a different subset of Census variables with a different focus:
- Index of Relative Socio-economic Disadvantage (IRSD)
- Index of Relative Socio-economic Advantage and Disadvantage (IRSAD)
- Index of Economic Resources (IER)
- Index of Education and Occupation (IEO)
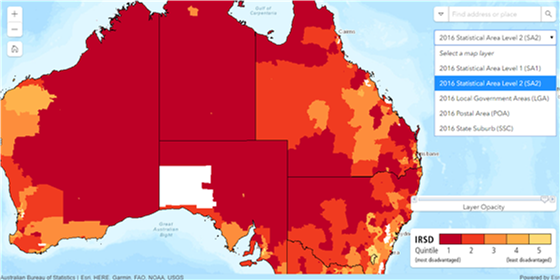
The website includes an interactive map for each index. If we enter Woden Valley ACT on the IRSD Interactive Map, the SA3 geographic area is not available in the drop down menu. Our selection is limed to SA1, SA2, LGA, POA or SSC, however data cubes with results by decile are available for the wider range of geographic classifications.
Sixteen variables are used in the IRSD index. The percent of people with stated household equivalised income between $1 and $26,999 per year is the strongest indicator of disadvantage. Other associated factors include unemployment, lower levels of education attainment, no internet connection, no car, overcrowded private dwelling and poor English language skills.
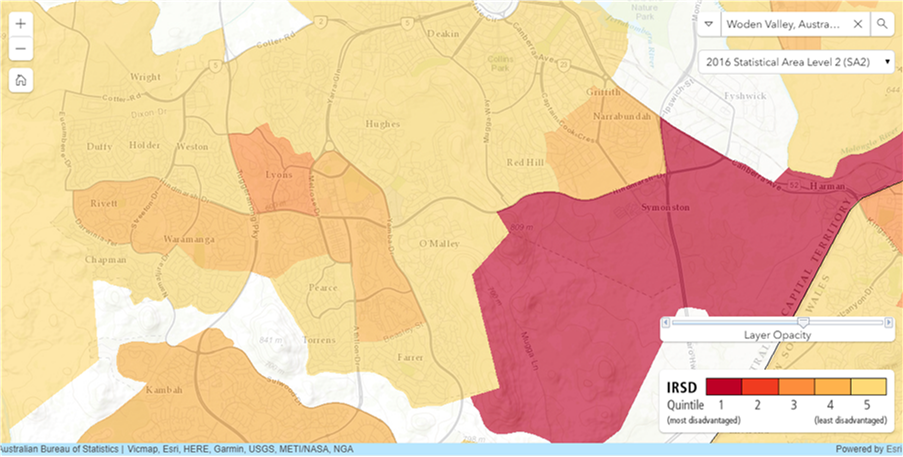
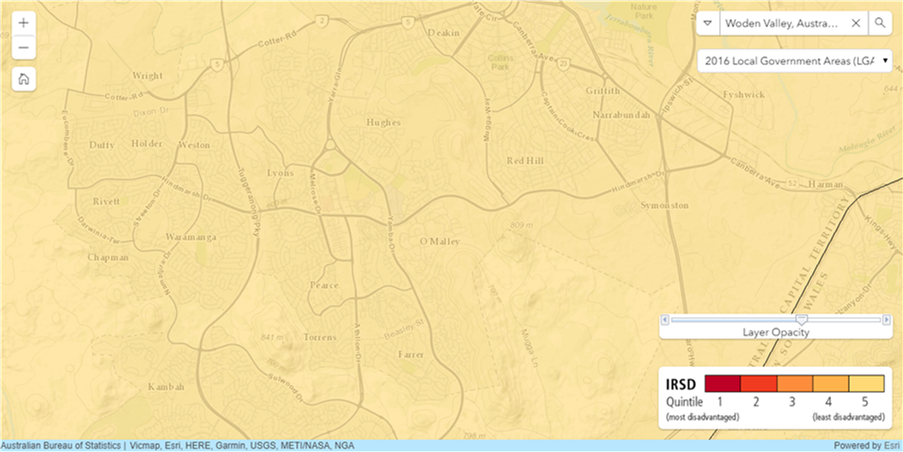
Unfortunately, the indexes are not foolproof. Selection of geographic area can impact the results as shown for Woden Valley, where choice of SA2 displays pockets of Quintile 1, most disadvantaged through to Quintiles 3, 4 and 5, least disadvantaged (on the left) suggesting a different socio-economic situation than when Local Government Area is selected with all areas being displayed as Quintile 5, least disadvantaged (on the right). This re-enforces the need to compare like with like to ensure appropriate interpretation.
Source Tom Cruise meme: Google images (unfortunately, the link goes to one of those surveys)

