
Health Data Snapshot, Part 3
A treasure trove of health data by location is available on-line. 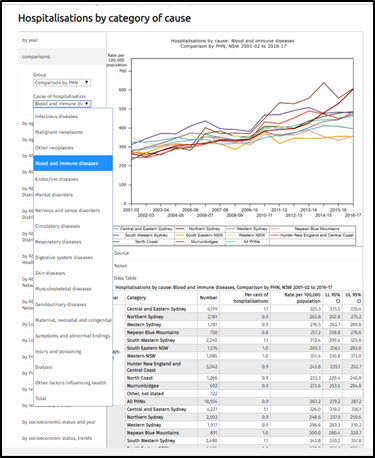
HealthStats NSW contains up-to-date information on over 200 health risk factors, diseases, locations, and specific populations within New South Wales. The flexibility and power of this resource is reflected in the snapshot of Hospitalisations by category of cause. The blurry graph shows a time-series comparison by Primary Health Network and all NSW for ‘blood and autoimmune disorders’. The data table is a click away below, the top down menu shows the other therapeutic categories that can be selected. Behind the drop-down are further choices based upon demographics, Aboriginal and Torres Strait Islander (ATSI) background and/or socioeconomic status.
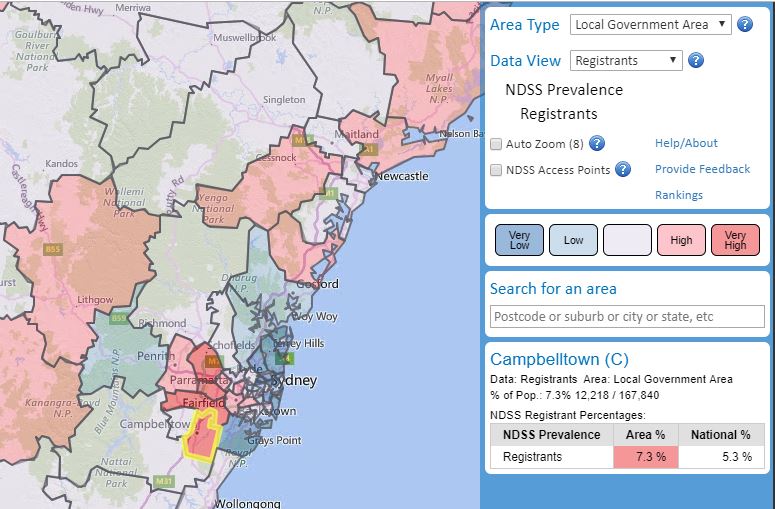
The National Diabetes Supply Scheme provides an on-line mapping tool of registrants by various geographical locations. This can also be filtered further by diabetes type, age, gender, ATSI and socioeconomic status. The example shown is for the Local Government Area of Campbelltown in NSW where the estimated prevalence of diabetes is 7.3% of the population, which is classified as very high comparative to the national average rate of 5.3%.
In addition to these interactive, web-based applications, reports collating specific data are starting to be published. Most recently, the AIHW released Potentially preventable hospitalisations in Australia by small geographic areas. This report provides information on 22 chronic, acute and vaccine-preventable conditions for which hospitalisation may have been avoided by the provision of timely and appropriate health care. Even though these reports usually contain data already available publicly, it is often cross-tabbed to provide different perspectives, and the quality of an AIHW analysis is assured.
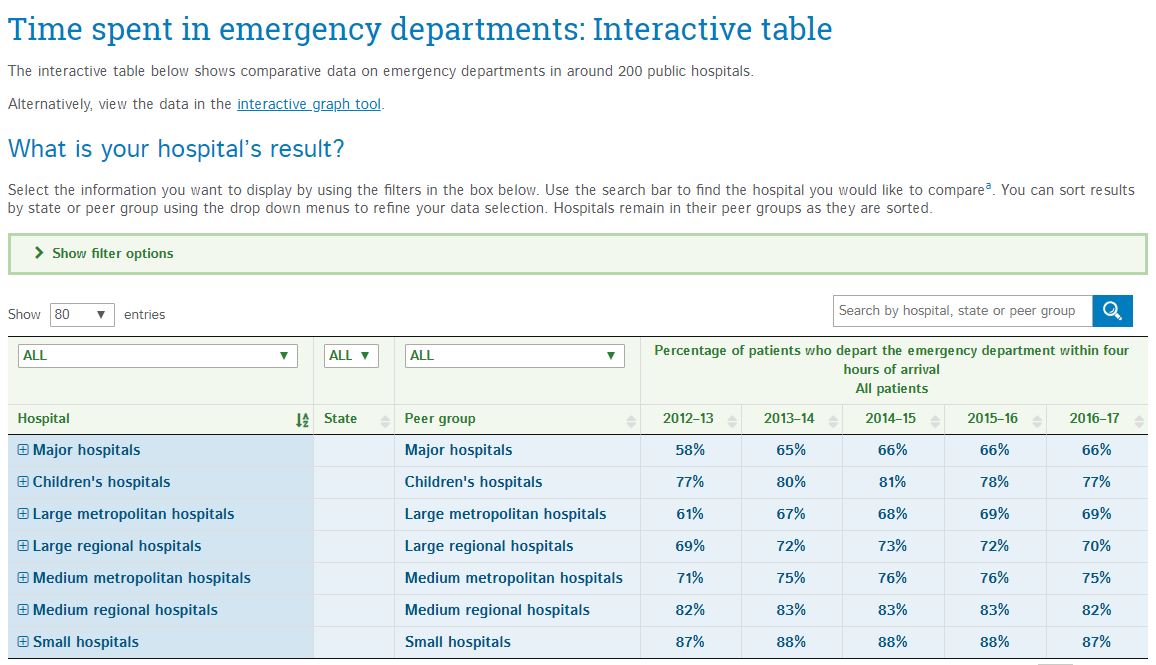
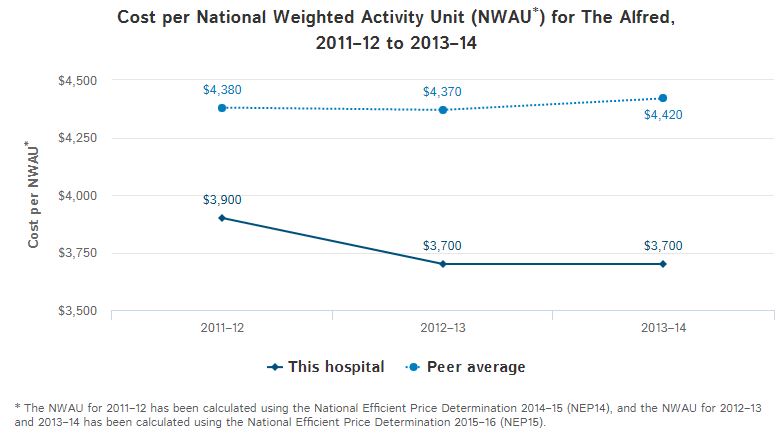
As the MyHealthyCommunities website is to national and localised primary healthcare data, then the MyHospitals website is to hospitals data. The site, established by the AIHW in 2010, includes data for over 1,000 public and private hospitals nationally. Hospitals can be searched for by state or postcode. Individual hospital profiles, services, and performance indicators can be viewed and compared to other hospitals. Information can be presented as a data table, such as the Waiting Time in Emergency Departments by hospital type shown (above), or graphically such as the financial efficiency data (activity based funding) presented for The Alfred, Melbourne (below). The site includes an explanatory videos and notes to assist in interpretation of information provided.
Graphic source: http://fchd.org/Clinic/CountyHealthData.aspx

