Three slices of the PBS

Like it or not, product and service providers to the PBS are in competition. 

The winners and losers during development and roll-out of the 2015 PBS Access and Sustainability Package (PASP) left no doubt about that. 

A collaborative approach within the sector, to increase the size of the currently diminishing pie, will be more sustainable and deliver better health outcomes.

(1) Manufacturers

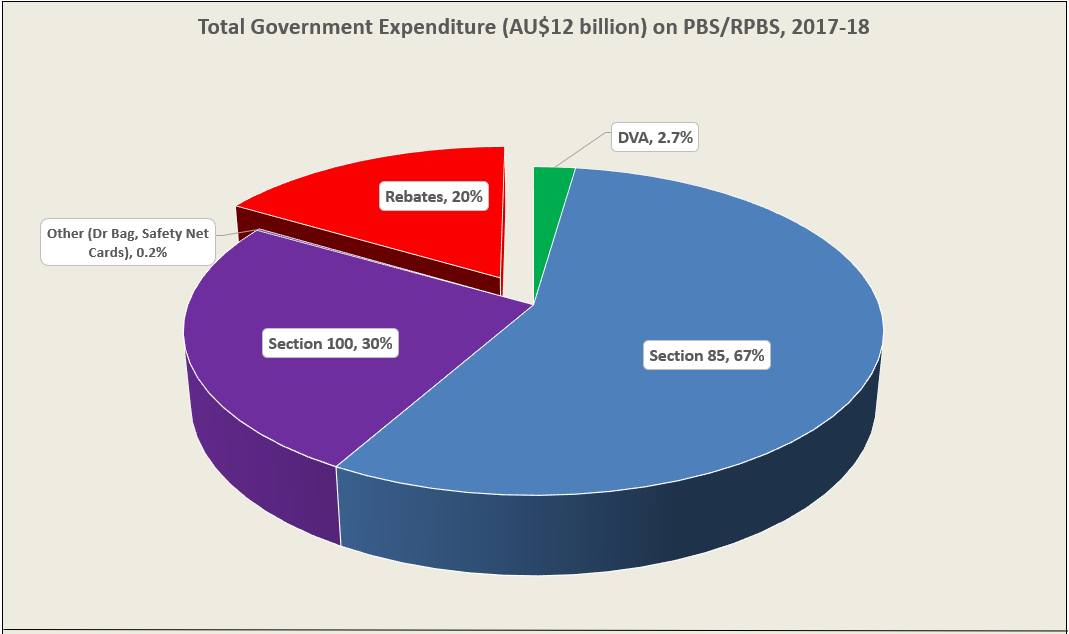
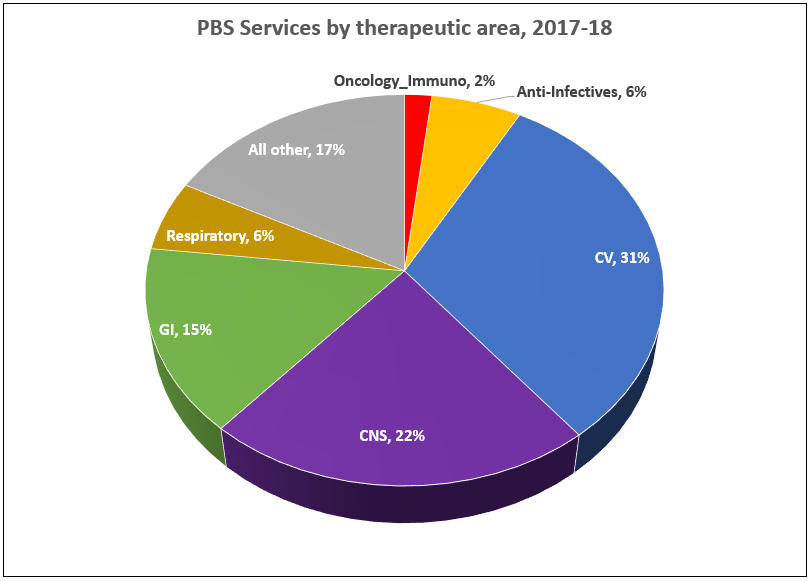
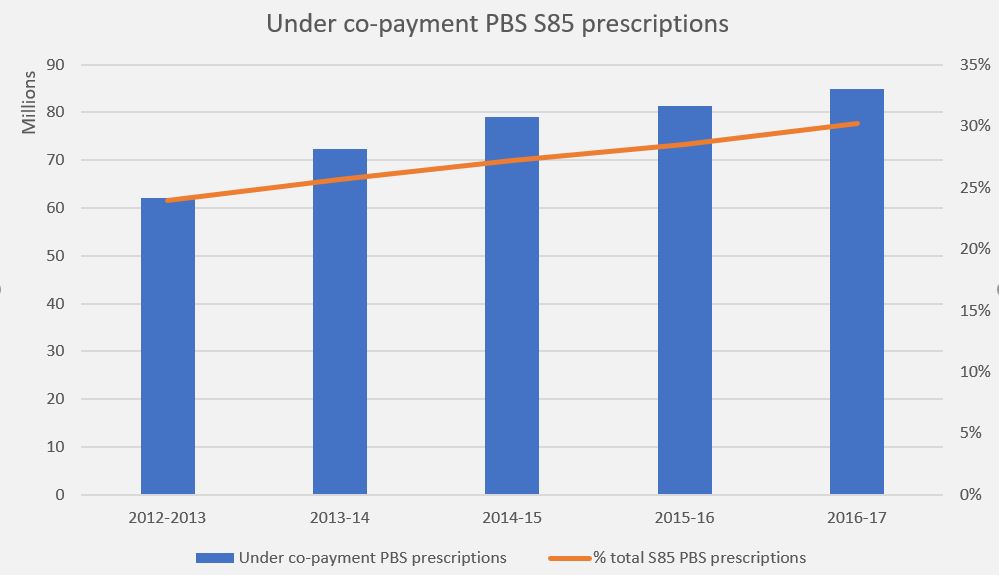
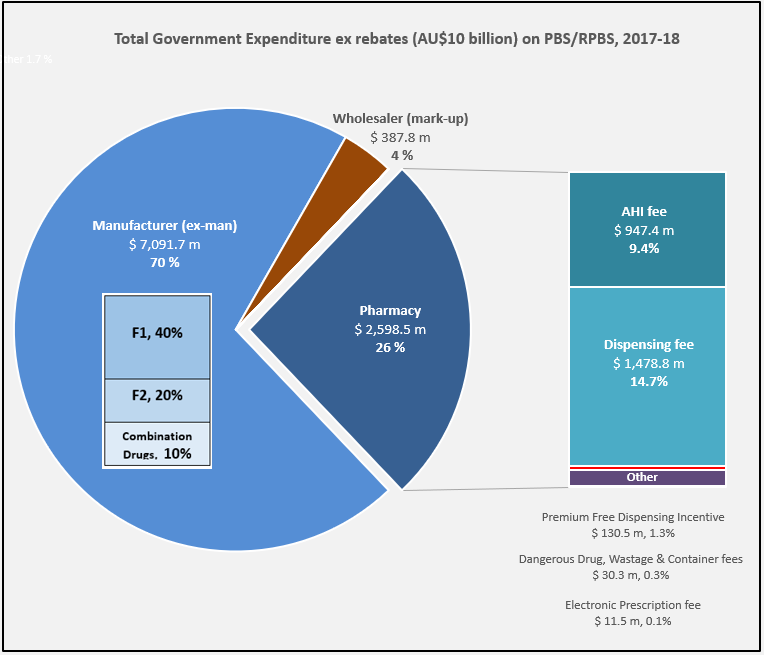
Manufacturer revenues accounted for approximately 70% of total Government Expenditure on the PBS/RPBS in 2017-18. In terms of costs, around 40% goes to innovator companies with single brand medicines in formulary F1; 20% to suppliers of multi-branded medicines in F2; and the remaining 10% for Combination products. The overall split, volume-wise, of prescriptions by formulary was F1, 11%; F2, 85% (half under co-payment and not represented in chart below); and Other, including combinations, 4%.

(2) Wholesalers

Wholesalers are remunerated via the regulated mark-up on ex-manufacturer price, currently 7.52%. This is agreed as part of the 5-year Community Pharmacy Agreement (CPA) negotiated with the Government of the day by the Pharmacy Guild. In 2017-18, payments to wholesalers represented only 4% of total Government expenditure on the schemes.

In their 2016 Submission to the King Review of pharmacy remuneration and regulation, the National Pharmaceutical Services Association (NPSA) re-iterated their view that the funding provided to wholesalers under the 6CPA is inadequate and unsustainable. This is even without including the impact of direct distribution to pharmacy model selected by some manufacturers.

The Community Service Obligation (almost $ 200 million per year) divided between full service wholesalers is not captured in the pie chart. However, a minimal increase on the previous CSO amount and a loss of  indexation during negotiation of the 6CPA, raises the question is anyone representing wholesalers at the table with Government?

(3) Pharmacy

The 2015 PASP/6CPA introduction of a flat, but CPI indexed Administration Handling and Infrastructure (AHI) fee successfully uncoupled community pharmacy remuneration from the price of medicines, and added to the growing range of professional services being remunerated. In addition to existing fees for dispensing, electronic prescriptions and incentives, such as to provide premium free medicines.

This approach has, and is, largely protecting pharmacy from the ongoing financial squeeze being experienced by manufacturers and wholesalers due to price disclosure, successive reforms and Department of Health activity.

Many of the professional service payments and pharmacy revenue, such as $600 m for the new Dose Administration Aid program and Minister Hunt announcements at APP2019, are not captured in the 26% of Government expenditure on the PBS/RPBS shown in the chart. For example, Clause 3.5 of the 6CPA notes: ‘The Commonwealth also estimates that community pharmacy will receive up to a further $4.8 billion from dispensing pharmaceutical items that are priced below the Maximum CoPayment.’ (1)

Bruce Annabel noted in a recent AJP article that ‘on average, pharmacies are receiving circa $30,000 pa services income’ with some generating over $200,000 pa.

With the PSA recently announced to join the 7CPA negotiations, and SHPA at APP2019 also wanting to play a role, as hospital pharmacists oversee more than 20% of annual PBS expenditure, there are going to be some unfamiliar faces at the table, very likely facing a new Minister of Health.

Sources: Department of Health Expenditure & Prescriptions Report; PharmaDispatch; Google Images


(1) The 6CPA bottom line of $18.9 billion to be paid to pharmacy over the life of the agreement, also excludes remuneration when community pharmacies dispense medicines under Section 100 special arrangements and the $372 m compounding fees which will be paid directly to chemotherapy compounders, who may not be approved suppliers.

The PBS pie

Using a pie analogy for Australia Federal Government spend on the Pharmaceutical and Repatriation Benefits Schemes in 2017-18, the impact of rebates is clear with approximately $1 in 5 paid out as benefits for medicines, ultimately returning to Treasury.

The total $2.36 billion in rebates was repaid wholly by innovator manufacturers on the basis of Deeds of Agreement with the Commonwealth. Such arrangements are necessary to enable PBS listing with a published price that globally protects the return of investment for capital risked while a new product is still in patent.

The size of the proportion is an indication of the negotiating power of the Department of Health on behalf of Australian taxpayers following a positive PBAC recommendation. It could also be considered a measure of why Australia is perceived as a ‘free rider’ in terms of investment in development. It may be a reflection of a distorted Health Technology Assessment process, with policies such as lowest cost comparator that often bear no semblance to clinical practice.

Graph Source: PBS expenditure prescription report, 2017-18. Image source.

PBS structural change

The long-term impact of 2007 PBS reforms are clearly evident when comparing patient categories by proportion of services and benefits. The introduction of separate formularies for single (F1) and multiple brand (F2) drugs plus successive price disclosure initiatives have fundamentally altered the structure of the Australian Pharmaceutical Benefits Scheme.

Despite ongoing increases in Concessional ordinary category (patient co-payment $6.50 in 2019) services (blue dashed line on graph), the cost paid/subsidised by Government (benefits, blue) has remained flat. Once a patient has paid $390 (60 items), the remaining services for the calendar year are provided free (Concessional Safety Net in green). Since the reforms the trend has been flat or downward, with recent significant drops most likely due to the $1 discount and other dampening policies on qualification.

While General category (co-payment $40.30 in 2019, shown in orange) services as a proportion of total has dropped away since the reforms, benefits paid by the Government for General patients (orange solid line) has almost doubled to account for 30% of total benefits in 2017-18. This is counter-intuitive as there are an increasing number of PBS items below co-payment and paid 100% out-of-pocket by patients. It is likely a consequence of the type and cost of medicines over the co-payment (refer earlier post PBS by therapeutic area showing increasing benefits paid for Oncology, Immunomodulators and Anti-infectives (Hep C) medicines).

The reducing service numbers in the General category (orange dashed) are influenced by the of loss of exclusivity on molecules with high prescription volumes and subsequent price disclosure. A similar dampening effect on the  Safety net qualification is also obvious over time.

Notes:

Patient category refers to a patient’s eligibility status at the time of supply of a PBS or RPBS pharmaceutical benefit. Concessions are available to Centrelink issued Pensioner Concession Card, Commonwealth Seniors Health Card and Health Care Card holders; as well as those with a Department of Veteran Affairs White, Gold, or Orange Card. General benefits apply if you do not have any of these cards. Further details are available on the PBS and DVA websites.

PBS Patient Category reports are available on the Government data.gov.au website as annual excel workbooks with month by month breakdown for the time period 1992 to 2016. Downloading directly from Medicare Statistics website is also possible for the period 1992 to current.

Image Source

PBS rewards innovation?

Last financial year (2017-18) the average benefit paid by the Australian Government per subsidised PBS/RPBS service was approximately AU $60 (1). However, separation of payments by therapeutic area (see graph) reveals a startling two-tier PBS with the majority of areas experiencing little growth in benefit paid since 1992-93, contrasted by those with consistent or dramatic spikes in growth.

How might this be interpreted?


One possibility is that, based on published list prices, the PBS/RPBS is rewarding innovation. The steady climb in benefit paid per service for Oncology-Immunological agents reflecting the ongoing innovation in this sector, with the consistent introduction of new, more cost-effective therapies.

The average benefit paid in 1992-93 for these drugs was $202.24 per service (in real 2017 dollars) representing approximately 3% of total cost to Government. In 2017-18, this had risen to $966.48 per service and Oncology-Immunology accounted for 32% of total Government cost of the PBS, but only 2% of total services. Specialists and patients in other therapeutic areas could question how representative this is.

In 2016-17, anti-infectives accounted for over 25% of all benefits paid by Government coinciding with peak uptake of newly listed Hepatitis C treatments. Although given the magnitude of rebates required in this area, revealed by a now-withdrawn poster, this information should only be considered guidance to trends.

The impact of price disclosure on benefit paid is clearly illustrated by the Cardiovascular (CV) therapeutic area. Over the 26-year period graphed, services as a proportion of all PBS activity have increased from 22% to 31%. Meanwhile, in 1992-93 the average benefit paid by Government per service was $35.39, peaking at $40.99 in 2003-04, and dropping to $15.24 in 2017-18 where CV medicines account for only 8% of benefits paid.

In terms of proportions, CNS medicines have remained relatively stable over the time period: 18% in 1992-93 to 22% in 2017-18 of services; 10% and 11%, respectively for benefits.

Gastro-Intestinal medicines have experienced a similar trend with an increase in proportion of services from 11% to 15%, while the benefit dropped overtime from 16% to 9%. This is most likely a reflection of the continuing prescribing of PPIs, and their loss of patent exclusivity.

The Respiratory therapeutic area has experienced a decrease in both the proportion of services (10% to 6%) and benefit (12% to 5%). A look at raw numbers of services shows a slight increase from 11.4 to 12 million over the period.

Methodology:

PBS/RPBS data downloaded from the Medicare Australia Statistics website for the period 1992 through 2018 was analysed by therapeutic area. The Anatomical Therapeutic Chemical (ATC) classification system, as recommended by the World Health Organisation (WHO) for drug utilisation monitoring and research (WHO 2019 Guidelines), was used. Benefit and service data was collated separately and then used to calculate the average Government benefit paid ($) per service by therapeutic area. Adjusting the benefit to adjust for inflation into real 2017 dollars did not alter the trends.

References: (1) http://www.pbs.gov.au/info/statistics/expenditure-prescriptions/expenditure-prescriptions-twelve-months-to-30-june-2018

Image source: http://cancer.nautil.us/article/196/why-cancer-drug-prices-keep-rising-in-the- us

The size of the PBS in 2030?

Extrapolating historical cost data, total Government expenditure on the PBS in 2030 is predicted to range from AU$11.5 to $14.5 billion.

The linear model based on actual PBS/RPBS expenditure after rebates in real terms (2017 $) from 1992-93 to 2017-18 (first graph) predicts a 2029-30 total cost of $14,400 m. This approach does incorporate the impact of Government policy changes and fiscal constraints, as well as the listing of new medicines and adjustment for inflation. Hence, the number is plausible assuming more of the same.

The 2% annual growth rate predicted by the trendline aligns with the recent IQVIA Institute Report on Use of Medicine (2019) that forecasts between 2019 and 2023, medicine spending growth rates in countries similar to Australia, are expected to be within a 1-4% range year on year. However, the Budget 2018-19 program expense for Pharmaceutical benefits, services and supply suggest that over $14 billion should be considered a stretch upside. This is due to the magnitude of projections for 2020-21 ($9,864 m) and 2021-22 ($9,787 m) once changes to supply chain arrangements take effect.

To better reflect the current environment, using only the past 10-years data, the 2030 PBS size lands at $9.7 billion (R2=0.1, low validity); while a trendline based on the last 15 years, predicts a total PBS of approximately $11.5 billion for 2030 (R2=0.7).

If benefit growth rates (%) are used rather than actual spend on the program as the basis for extrapolation, using linear extrapolation results in increasing negative rates (to -6.8%) and a PBS of AU$6.3 billion in 2029-30! As this is nonsensical, a moving average over 3 periods has been used to construct a trendline (second graph) and this provides an estimate of total PBS size of $11,865 m in 2030.

Using projected growth from 2014-15 to 2027-28 in real pharmaceutical spending per person from the most recent Intergenerational report (2015), plus the assumption that 80% of the growth is expected to come from non-demographic factors, the 2027-28 PBS total figure can be expected to be around $ 10.5 billion, supporting that the 1992-2018 linear extrapolation may be an overestimate.

Assuming the future holds the same in terms of policy & innovation, the total PBS will cost Government < $13 billion in 2030. How much of that amount goes to which parts of the sector will depend on how effectively stakeholders make their individual cases.


Sources: Expenditure data available from 1992 on the Medicare Australia Statistics website, picture & PBS logo

PBS Top 10

NPS MedicineWise has published* the Top 10 drugs for the financial year July 2017 to  June 2018 based on PBS and RPBS prescriptions. The data is based on date of supply of all prescriptions including those under the co-payment, sourced from the Department of Health in October 2018.

The top 10 medicines by cost to government are single originator brand products from the F1 formulary that, at the time of PBS listing, represented breakthrough innovations in their therapeutic area. Specifically, in the treatment of hepatitis C, macular degeneration and solid tumours. Overall, the ten represent 23% of government expenditure on the PBS and less than 1% of prescription volume.

Gilead’s Epclusa®, Harvoni® and Solvadi® occupy first, fourth and seventh place, respectively. These  account for almost 10% ($1.15 billion) of expenditure according to the data. However, rebates are not included and hence the real value that the Government place on this scientific breakthrough, on behalf of Australians, is unclear. The confidential nature of the effective price means it can be assumed that it is less than what governments and patients are prepared to pay elsewhere.

Anti-neoplastic and immunomodulating agents in the top 10 account for 7.3% of spend with AbbVie’s Humira®; Roche’s Herceptin® and the more recent checkpoint inhibitors, Opdivo® (BMS) and Keytruda® (MSD) represented. The top 10 for cost to government is rounded out by Bayer and Novartis with their macular degeneration treatments, Eylea® and Lucentis®, respectively. Xgeva® (Amgen) for bone mineral density is included at #8.

It must be assumed that risk share and/or special pricing arrangements are in place for all of these products. Thus the dollar values listed are likely to include rebate and cap re-payments that contribute to the PBS drug recoveries figure of $2.36 billion in the Department of Health Annual Report 2017-18.

Not surprisingly, the top 10 medicines by prescription volume all hail from the F2 formulary with multiple brands available. Cardiovascular treatments for cholesterol (rosuvastatin and atorvastatin) and blood pressure (perindopril) account for almost 14% of scripts dispensed. This is followed by protein pump inhibitors (esomeprazole and pantoprazole) for GORD and ulcers with 8% of volume. The  ‘overprescribed’ anti-infectives cefalexin, amoxicillin and amoxicillin with clavulanic acid, represented 7.5% of all prescriptions supplied in 2017-18. Metformin for Type 2 diabetes and escitalopram for depression and anxiety are # 8 and #10, respectively.

Source: Australian Prescriber* and Medicare Australia Statistics

The top 10 for defined daily dose (DDD) per thousand population per day is also included in the article and is suggested as a more useful measure of drug utilisation than prescription counts. It shows how many people in every thousand Australians are taking the standard dose of a drug every day. The list includes eight products for treatment of chronic cardiovascular disease (atorvastatin, rosuvastatin, perindopril, amlodipine, irbesartan, candesartan, telmisartan and  ramipril). Esomeprazole and metformin complete the ten.

*Australian Prescriber 2018;41:1943 Dec 2018 DOI: 10.18773/austprescr.2018.067

Image source

Under PBS co-payment data

The Fifth Community Pharmacy Agreement (5CPA) contained a clause requiring community pharmacies to provide data to the Commonwealth on each PBS prescription dispensed at a price below the general patient co-payment. This was $35.40 when collection began on 1 April 2012 following enactment of the National Health Amendment (PBS) Act 2010. Prior to this date, PBS prescription data was only collected when a Government subsidy applied, reflecting the original purpose of the system.

The collection of data on use of PBS medicines by the Australian population has become an important secondary function. The combined impact of an increasing general co-payment amount (linked to CPI) and decreasing manufacture prices (price disclosure once off patent, no CPI), mean that a high proportion of medicines listed on the PBS are now priced below the general patient co-payment.

Given that such medicines include many commonly prescribed antibiotics, as well as medicines and other items associated with management and treatment of chronic diseases, it is important to fill this information gap. The Department of Health engaged KPMG to conduct a Combined Thematic Review of Access, Consumer Experience and Quality Use of Medicines under the 5CPA. The March 2015 Final Report did find that the initiative supported this aim. The data is collected from public and private hospitals and 99% of community pharmacies. It provides a tool for health policy planning, research, pharmacovigilance, monitoring risk management protocols and quality use of medicines in the community. The additional data has also been used to improve the accuracy of information available to the Pharmaceutical Benefits Advisory Committee (PBAC), among other decision makers.


The number of under co-payment Section 85 prescriptions dispensed on the PBS from 2012-13 through to 2016-17 are shown in the graph. The volume is increasing, however of more interest is the under co-payment prescriptions as a proportion of total PBS S85 prescriptions dispensed shown by the orange line. This was 24% in 2012-13 and increased to over 30% in 4 years.

Almost one third of S85 PBS prescriptions dispensed in Australia during 2016-17 were under co-payment and paid for by patients (out-of-pocket). Clearly medicines are affordable or the PBS is not the universal scheme it is generally stated to be.

Other gaps continue to exist in medicine usage data, for example, for medicines down-scheduled off the PBS to over-the-counter availability.


Sources: PBS statistics and Expenditure reports (www.pbs.gov.au); The Simpsons.

Same bed, fewer different dreams?

Tackling a burgeoning inbox always reveals a few gems, such as the article by Ting Wang et al. published last month in ISPOR’s journal Value in Health (2018;21:707-714).

Wang and colleagues developed separate surveys for international innovative pharmaceutical companies (n=19 companies with 29 respondents) and Regulatory (n=7; 13 respondents) & Health Technology Assessment agencies (n=8; 12 respondents) from Australia, Canada, and Europe. Questions referred to the past 5 years and alignment of regulatory and HTA evidence requirements and synergy of processes.

The findings are not surprising to those working in the HTA space for more than 5 years. In particular, with regard to the increasing need for HTA requirements to be included earlier in drug development with unanimous responses from the three key stakeholders (Figure 1, bottom statement). The high drop-out rate of molecules as they move along the development continuum and associated sunk costs mean that early studies focus on efficacy and safety variables. Collection of variables for economic evaluations (e.g. Quality of Life at specific time points, resource use, follow-up beyond primary efficacy parameter, subsequent treatments, etc.) to demonstrate cost-effectiveness is usually left to Phase III and too late for fast-track/priority reviews based on Phase II data. Once a medicine is registered, the opportunity to collect comparative data disappears, and often with it the ability to demonstrate the real value of the new medicine over existing treatments to a healthcare system.

Figure 1: Company respondents’ views on the regulatory and HTA requirements


Abbreviations: HEOR Health Economics, Outcomes and Research

Figure 1 also shows that the potential negative impacts on innovation by HTA are recognised across the stakeholder groups as incremental gains are considered not to be rewarded by current HTA processes. Further education around HTA may drive policy changes that recognise and stimulate innovation in the sector.

Surprisingly, HTA agencies appear less concerned than their regulatory counterparts of the pressures to speed time to access to new medicines (as shown in Figure 2). The value of sharing of information to reduce duplication is also mismatched. This may be a consequence of the lack of clarity in differences in data requirements for the evaluations, which is alluded to by the higher response rate from HTA agencies on the need to align scientific requirements for the two processes. HTA evaluations are based on comparative efficacy and safety as applies to local clinical practice, whereas regulatory agencies focus on overall risk : benefit. The comparator is usually the currently most prescribed product used for treatment in a market, and costs are based on local circumstances. As such, there is considerable variability between HTA evaluations between countries, whereas the Common Technical Document (CTD) is generally acceptable with local modifications to all regulatory jurisdictions.

Figure 2: Main drivers for regulatory and HTA agency collaboration


The article also includes further findings, more detail in supplement materials and a comprehensive set of recommendations on how to improve synergy between agencies. Pop this publication on your reading list as you travel to your next meeting with a regulator or reimbursement agency.

Source of main photo: ‘Same Bed, Different Dreams’ South Korean TV show aired in Australia by SBS

CSO perspectives & direct distribution

Feedback on my recent post about the Community Service Obligation (CSO) has provided some alternate viewpoints:

(1) Like Australia’s population, 80% of PBS items are distributed in urban areas. Hence, irrespective of the per item delivery cost, the business of distribution in major cities and larger regional centres will be profitable due to economies of scale, and the ability to offset transport costs with multiple other deliveries, particularly if not solely distributing pharmaceuticals. It is only the 20% of rural and remote deliveries that require Government subsidisation to ensure timely equitable access to PBS medicines for patients.

(2) Apparently, the counter-intuitive is the case. In urban and regional centres, distributors own and operate their own delivery infrastructure and twice a day (at least) deliveries and special orders are guaranteed as part of service agreements. However, rural and remote distribution is generally via existing transport networks. Delivery schedules are less frequent and only cost when an order is made. Consequently, the average distribution cost per item may actually be less for deliveries to rural and remote pharmacies.

(3) An economist perspective, as provided by Dan Swain (Swain Health Economics), regarding the need for a CSO funding pool. On one hand, the annual CSO cost of approximately $200 million to ensure timely delivery of any PBS item anywhere in Australia, may be considered a good investment in the context of the $10 billion annual Government expenditure on the PBS.

On the other hand, the need for a subsidy may be a signal that the pharmaceuticals distribution market is in need of restructure. That is, the CSO may be propping up an unsustainable business model instead of permitting market forces to operate as they would in a less regulated environment.

This standpoint is supported by the decision of 13 companies to date, led by Pfizer in early 2011, to adopt a direct distribution model to community pharmacies across Australia for some or all of their products. They have chosen to by-pass the full-line wholesalers completely or opted to distribute directly in addition to the existing channel.

In the case of Pfizer, this covers all PBS product lines, includes a dedicated field force and a single logistics provider (the DHL direct-to-pharmacy distribution service is known as ‘Pfizer Direct’). In this case, the aim of direct distribution was and is to protect sales of Pfizer brands from generic competition, in particular as a number of its highest volume products lose patent protection.

At the recent PharmaDispatch Conference, the reasons given by Liz Chatwin, Country President AstraZeneca, for last year’s decision to go direct for nine high cost products included, in addition to the financial savings, improved data collection leading to a better understanding of patients and how products are being used, without compromising service standards.

An overarching assumption is that the cost to distribute directly via DHL is less than the 6CPA mandated distribution costs (7.52% of ex-man cost <$930, or $70). DHL distribution occurs independent of CSO funding, however the impact on CSO distributors is immediate as they are compensated monthly in arrears based on items supplied.

Opponents to the the direct distribution model note the increased administrative burden placed on pharmacies, and an increase in medicine shortages as more companies have gone direct. The Pharmacy Guild and National Pharmaceutical Services Association are concerned that exclusive monopoly supply arrangements put the first objective of the National Medicines Policy at risk, namely ‘Timely access to the medicines that Australians need, at a cost individuals and the community can afford’.

Submissions to the current Government review of the CSO will undoubtedly present detailed arguments and evidence supporting  these divergent opinions.

The CSO because <5% of PBS medicines are profitable to distribute

During evaluation of the third Community Pharmacy Agreement (2000-2005), gaps in the pharmacy network that didn’t meet the ‘reasonable access to PBS medicines regardless of place of residence’ (National Medicines Policy) test were recognised. At the same time, the Federal Government was also concerned about long term PBS growth and identified pharmacy distribution as a potential area to reduce expenditure.

These two issues were ultimately solved in the fourth CPA (2005-2010) with a reduction of the wholesale price mark-up from 11.1% to 7.52%, and the establishment of a Community Service Obligation (CSO) Funding Pool (AU$150 million per year, indexed annually, paid monthly in arrears) for direct payments to those pharmaceutical wholesalers who supply the full PBS range of medicines and distribute in a timely manner anywhere in Australia.

The CSO was continued in the fifth and sixth CPAs providing approximately $200 million per year in direct financial support to the five eligible pharmaceutical wholesalers for any additional costs incurred in providing the full PBS range. However, as Mark Hooper, Chair of the peak body for CSO distributors, the National Pharmaceutical Services Association (NPSA) showed in his 2016 APP presentation, the combined impact of patent losses, price disclosure and changes in fee structure, to flat fees rather than percent of value, are also at play. The result being that over the course of the 6CPA, wholesalers revenue will decrease by at least $400 million.

Modelling commissioned by the NPSA shows that sustainable funding, such as provided by the CSO, is even more critical to retaining service standards as the proportion of low costs drugs by PBS prescription volume increases.  By 2020 approximately 84% of PBS medicines will cost less than $15 (AEMP) while the range of PBS medicines will increase by up to 50% due to generics. In other words, over time wholesalers will continue to be delivering more and more units for less cost.

The CSO came under scrutiny during the independent King Review (a 6CPA commitment) with the final report recommending a comprehensive analysis of the entire pharmaceutical supply chain. The Department of Health is currently undertaking a targeted consultation of the CSO.

Interestingly, the King Review also recommends that ‘the Australian Government should ensure that the regulation and remuneration of wholesaling of PBS-listed medicines should not form part of future Community Pharmacy Agreements.’ Time for wholesalers to step out of the Pharmacy Guild shadow and negotiate for themselves.