The fate of ‘fee for service’ GP visits

Without structural change to the way in which health care is delivered and financed, the Australian health care system will continue to struggle to meet contemporary needs and expectations of its citizens.

Mitchell Institute Policy Issues Paper ‘Australian Health Services: Too complex to navigate’ February 2019

SIMPLIFICATION REQUIRED

An analysis of previous reviews of Australia’s health service was undertaken by the Mitchell Institute early this year. The authors report successive reviews concluded that existing funding arrangements impede the delivery of clinically effective and efficient health care, in particular for chronic diseases.

Consequently, the report, as those that have come before, recommends restructuring of current health financing arrangements to move the focus, and incentives, from high cost reactive healthcare towards investment in prevention services to reduce disease, as well as management of chronic health conditions.

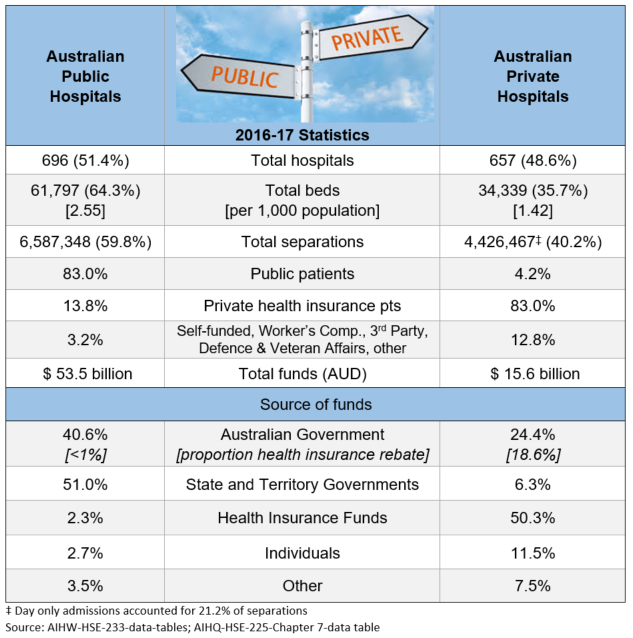
A publicly funded universal insurance system in concert with private health insurance should be retained. However, the basis for remuneration of providers must ‘encourage sustained prevention, early detection and management of chronic disease and coordination of services to reduce duplication and more effective use of information’.

HEALTH CARE HOMES (HCH) TRIAL

It was on the basis of one such report (Dec 2015) that the Primary Health Care Advisory Group# recommended implementation of a Health Care Home model of care. The intent being provision of a ‘home-base’ (GP practice) for patients with complex and chronic conditions, where the care needed would be coordinated on an ongoing basis.

Stage 1 of the HCH program was to be trialled in 200 GP practices and enrol up to 65,000 patients (later modified to a cap of 12,000) by 30 June 2019. However, at this time only approximately 99 of the 175 registered practices were active with a total of 2,075 enrolled patients. The implementation of the pilot has been roundly criticised, with even the Royal Australian College of GPs withdrawing their support for the scheme (see August 2018 Medical Republic article).

In December 2018, the Government extended the HCH trial for an additional eighteen months to 30 June 2021. At the same time, it was announced that Health Policy Analysis (HPA), an independent organisation had been contracted by the Department of Health to undertake an evaluation of the implementation of Stage 1 in collaboration with experts from the University of NSW and the University of Technology.

Zong et al. 2019, Figure 2

In response to an enquiry, the Department of Health confirmed that this evaluation ‘is progressing well, with the second round of data collection and analysis under way‘. They also noted that ‘the evaluation has been extended to 2021, in line with the extension of the program. HPA will now deliver the final evaluation report to government late 2021. It will be a decision for government on whether to release the findings of the evaluation to a wider audience.’

IS LEGISLATION NECESSARY?

In 2012, the US State of Massachusetts enacted a law to control health care spending. This was in response to increases such that by 2010, costs of Medicaid and private health insurance for state employees accounted for almost 40% of the state’s annual budget. Key elements of the law include:

  • limiting the growth of health care spending to growth in Massachusetts’ economy as measured by the gross state product (GSP);
  • shifting from fee-for-service care to global payment models;
  • supporting the formation of Accountable Care Organisations and patient-centred medical homes to improve quality and control costs; and
  • promoting greater transparency through expanded public reporting of health care providers’ quality and cost data.

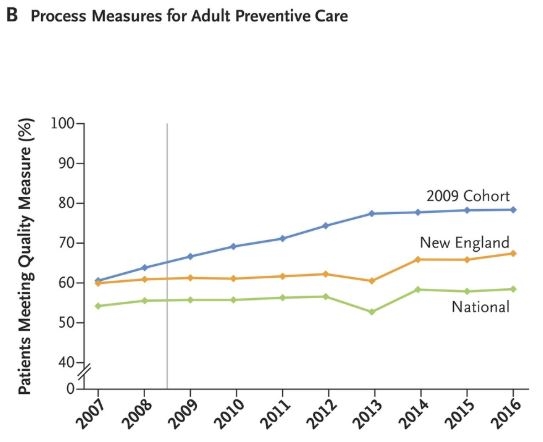
Eight-year results were reported in the NEJM in July (4), and demonstrate that global budgets and financial incentives for improving quality and controlling costs work. On a range of measures those patients treated under terms of the new law (labelled as 2009 Cohort) received better quality care compared to patients in surrounding States (in New England region), and the rest of the US (National). The graph shows the proportion of patients meeting quality standards for preventative care over time between these three groups. The grey vertical line is the introduction of the new law. Overall on the range of measures followed, patients experienced better health outcomes for less cost which must catch the attention of Ministers of Health!


# The Healthier Medicare initiative of the Abbott Government included establishment, by the then Health Minister Susan Ley, of the Primary Health Care Advisory Group to investigate options for the reform of primary health care to support patients with chronic and complex illness, including mental health conditions.

References
1. Hayes P, Lynch A & Stiffe J. Moving into the ‘patient-centred medical home’: reforming Australian general practice. Journal of Education for Primary Care  2016;27(5):413-15.

2. Song Z and Landon BE. Controlling Health Care Spending — The Massachusetts Experiment. N Engl J Med 2012; 366:1560-1561.

3. Ayanian JZ and Van der Wees PJ. Tackling Rising Health Care Costs in Massachusetts. N Engl J Med 2012; 367:790-793.

4. Song Z, Ji Y, Safran DG and Chernew ME. Health Care Spending, Utilization, and Quality 8 Years into Global Payment. N Engl J Med 2019; 381:252-263.

Image source

In defence of Private Health Insurance?

Having been hit by the proverbial bus (#), although in my case, it was a toboggan, my recent encounter with the Australian healthcare system has left me in awe!

From the impromptu consultation with a holidaying ER specialist; the ordered chaos of the Perisher Valley Medical Centre; the administrative whiz at the Sydney rooms who got a specialist to look at my X-rays, found an early morning appointment followed by an emergency MRI slot. This on the way to the hospital to prepare for surgery, by the said surgeon who added me, along with 2 other ‘urgents’, to the list. The hospital nursing and other staff were as competent and professional. A simple thank you seems inadequate.

Once on the list, the private hospital called to inform me that my PHI fund had agreed to pay for my stay. All I would need to pay was the $450 excess (a trade-off applying to each separate admission for some fee relief). The actual admission process was reminiscent of those scenes from American movies where the parent/partner finds out the very expensive care that his/her loved one needs is not covered by insurance.

I was out of pocket every step of the way. I was well informed upfront as to what costs were likely to be involved. Except for the anaesthetist (and assistant surgeon), whom introduced themselves and then promptly injected me with a cocktail of medicines that mean I can’t remember a thing!

What is one to do in this situation? I didn’t explore the possibilities of not being able to pay the gap between what was being charged and the Medicare scheduled fee. To avoid an out of pocket I would have needed to be driven to a medical service in Jindabyne (35 km) or even Cooma Hospital (100 km) emergency department for the initial consultation and an X-ray. Is it a part of Australian folklore that everyone should be bulk billed at a GP level?

The Australia Medical Association Guide for Patients on How the Health Care System Funds Medical Care (2015) notes that:

  • ‘The Medicare Benefits Schedule (the MBS) is a list of the medical services for which the Australian Government will pay a Medicare rebate, to provide patients with financial assistance towards the costs of their medical services.
  • Medicare rebates do not, and were never intended to, cover the full cost of medical services.
  • Medical practitioners are able to set their own fees for their services.
  • The MBS fee and the Medicare rebate do not reflect the value of a medical service or an amount that medical practitioners should or must charge.’

The same applies to specialist medical fees, as consultations and procedures are covered by Medicare, not PHI. Again, where a gap exists, it must be filled by the patient.

Is PHI being unfairly blamed as the cause for all the gaps and out of pockets, when maybe Medicare was never meant to be as universal as we all wish it was?

I will revisit once all the invoices have arrived!

# with reference to Jenna Price SMH 19 July 2019

Should you go private?

The 44.5% of Australians who have private health insurance (PHI) for hospital treatment can choose to use that insurance to completely or partially fund their stay in a public or private hospital. 

When should a Medicare card holder, eligible for free treatment as a public patient in a public hospital, who also has PHI hospital membership, elect to use it?

Less than 10 % of the time appears to be what is acceptable to the healthcare system.

This figure is based on the status quo. In 2006-07, an average of 8.2 % of patients admitted to public hospitals used PHI (essentially rural/remote patients with limited choice and certain specialists who need to work in a public facility). As that figure has increased over time, reaching 13.5 % nationally in 2017-18, it has become a topic of concern, regularly debated and considered unsustainable#.

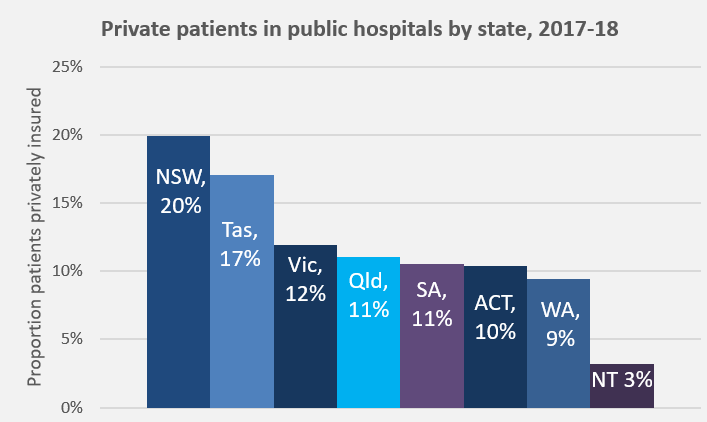
Unfortunately, individual patient needs do not really feature in the discussions. Analyses of which type of patients, procedures, and waiting times have contributed to the increase, and reporting of coercive techniques being used on patients to elect PHI, all point back to assumed financial benefit as the driver.

Public hospitals welcome private patients as they bring funds from an alternate source, and hence save money in their budgets. However, according to a 2018 Report by Martyn Goddard on Tasmanian public hospitals, ‘for each patient admitted as private, the public hospital loses an average of $1,800, compared with treating the same patient publicly‘. He notes that it is a myth that private patients contribute additional funds into public hospitals because the hospital only gets PHI payment for the treatment (that does not cover infrastructure, administration, catering etc. costs) and the Federal Government does not  fund these patients with the usual percent of the national efficient price, on the basis that it already pays for Medicare and the private insurance rebate. So the hospital gets only a fraction of the usual activity-based funding**.

Patients think they are doing the right thing by using their PHI and assisting the public system to free up resources to treat more public patients or conduct research. However, they actually open themselves up to additional costs via excess/co-payments and out-of-pockets from gap specialist charges.

Whatever the altruistic motivations of this cost-shifting to the private sector, it results in  upward pressure on insurance premiums. This then sets off a sequence of events to rival ‘Mouse Trap’, except everyone seems to get caught with the cheese at the end.  When PHI premiums go up, people drop their private health insurance. These people then rely on the public health system and the health insurance rebate age penalty actively works against them opting back into private insurance at a later date. 

The more privately insured people who use their cover in public hospitals, then the less beds are available for public patients and waiting times go up in the public hospital system producing a political issue for both State and Federal Governments. Some public patients are shunted to private facilities (this already happens at a pretty constant rate of 4% of separations per annum).

In reality, these are no true private hospitals, rather a symbiotic relationship exists between public and private across the Australian healthcare system. The table shows that PHI accounted for 50.3 % of private hospital funding in 2016-17. A further 30 % coming from Federal and State Governments, including Medicare payments for medical services and the private health insurance rebate.

**The National Health Reform Agreement requires IHPA to set the price for admitted private patients in public hospitals accounting for these payments by other parties, particularly private health insurers (for prostheses and the default bed day rate) and the Medicare Benefits Schedule (MBS). Documentation of revenue received for delivering care from sources other than through the (i.e. public patients in a public hospital) is not consistent and a correction factor has been introduced as an interim step.
Image source

After the vote …

Whoever takes on the mantle of Health Minister in the 46th Federal Parliament will have a full reform agenda to prosecute.

The return of the incumbent LNP means Budget 2019/20, as presented in early April, should be rolled out. In terms of health, the focus was on continuing initiatives to progress the four pillars* of the Coalition’s ‘Long Term National Health Plan’.

  1. Guaranteeing Medicare and Access to Medicines [MBS and PBS]
  2. Supporting our Hospitals [State funding] 
  3. Prioritising Mental Health, Preventive Health and Sport
  4. Investing in Health and Medical Research [Medical Research Future Fund].

The development of the Long Term National Health Plan had been announced two years earlier by the Hon. Greg Hunt, who was at the time relatively new to the Health portfolio. The announcement was preceded by focused activity to sign compacts with potentially vocal and volatile stakeholders. These compacts and other relevant agreements due for re-negotiation are listed in the table.

Agreement / Compact Other Party (ies) End date Key Purpose
National Health Reform Agreement (and Addendum) COAG States and Territories 30 June 2020 Public hospital fundingHealth Care Home (HCH) model
Community Pharmacy Agreement (6CPA) Pharmacy Guild 30 June 2020 Community Pharmacist renumeration; Wholesaler payments; funding for community pharmacy programmes, Pharmacy Location Rules
Compact: A Shared Vision for Australia’s Health System AMA 2020-21 (period of forward estimates from 2017-18 budget) Early resumption of MBS indexation; reversal of bulk billing incentives for pathology and diagnostic imaging; MBS review; My Health Record uptake; Health Care Homes
Compact: Strengthening Medicare RACGPs 2020-21 (period of forward estimates from 2017-18 budget) Early resumption of MBS indexation; MBS review process; after-hours MBS items; workforce reform; My Health Record uptake
Strategic Agreement MA 30 June 2022 Delivery of $1.8 billion in savingsPBS process improvements
Strategic AgreementCompact: Strengthening PBS-Measures to Support Generic and Biosimilar Medicines Uptake (2-year extension) GBMA 30 June 2022 greater certainty of Government pricing policies for F2 Formulary medicines with brand competition, in an environment of ongoing medicine price reductions associated with price disclosure

The compacts were said to be a platform for the national plan and ‘underpinned by a range of shared principles …, transparency in decision making, accountability for reforms, stability and certainty in regards to Government investment‘.

The ultimate success of this approach was reflected in how health was debated equally alongside the other common issues important to Australians in the lead up to yesterday’s election (no controversy, unlike Mediscare in 2016).

The roll-out of the National Plan reforms is scheduled in 3 waves:

  • Wave 1: guaranteeing Medicare, agreement by COAG on a opt-out model for My Health Record and investments in mental health psycho-social support;
  • Wave 2: sustainability and affordability of private health insurance, mental health particularly in rural areas, workforce strategy, aged care reform; and
  • Wave 3: reform of public hospitals and post 2020 agreements with the states, primary health care and preventive care.

Activity appears to have been well progressed into Wave 2 when the election was called.

Wave 1 was said to be ‘underpinned by the 5 major compacts with medical and industry bodies’. The next Federal Minister of Health will be in demand by these bodies as the compacts (and agreements) come up for review.

*Note: Aged Care was also specifically addressed by the 2019/20 Budget in the environment of an ongoing Royal Commission.

Image source

Global epidemic?

The statistic is startling: between 2018 and 2040, global cancer mortality will increase by 63% due to demographic changes alone.

The bulk of this impact is projected to be experienced by low and middle income countries as their, generally much larger,  populations age and economic development moves the cancer mix profile closer to those observed in high-income nations. Even now, although 59% of cancer cases occur in middle- and low-income countries, they see 71% of cancer-associated deaths.

As people live longer because they are not succumbing to previously fatal conditions, the proportion of populations for whom cancer is the cause of death will increase. It is this burden that the tag ‘epidemic’ is being used to label.

Australian age-standardised death rates, by broad cause of death, 1907–2016

In Australia, the changes in cause of death over time due to improvements in hygiene and healthcare, show that the age-standardised rates for cancer have not altered dramatically over the past century. In fact, cancer (all neoplasm) deaths, after adjusting for differences in age structure, peaked in 1985 (217 deaths per 100,000 population) and have subsequently declined to the 162 deaths per 100,000 population recorded in 2016.

Australia rated poorly on Cancer Preparedness for workforce density (in particular, radiation oncologists, clinical oncologists and surgeons); the capacity of radiotherapy equipment to meet patient need; and the change in out-of-pocket expenditure over 10 years.

To allow bench marking and initiate discussion on best practice, as part of the World Cancer Initiative, the Economist Intelligence Unit (EIU) Healthcare has published an Index of Cancer Preparedness (ICP) combining findings for 45 separate data points to provide a comprehensive overview of how well the 28 included countries are doing in the key areas of this challenge. The study was sponsored by Novartis, Pfizer and Roche.

The associated white paper describes the need for coordinated services across prevention, early diagnosis, treatment, palliative care and survivor support for effective cancer control. It describes elements that indicate the preparedness of a healthcare system to cope with the existing and projected burden including investment, national cancer control plans, accessible general health system and governance & population-based cancer registries.

The mortality-incidence (M:I) ratio (the number dying of cancer in a given period divided by the number of new cases) is used as a measure of healthcare system success against cancer. The EIU found that this ratio correlates closely, and negatively, with GDP. One of the biggest influences in poorer performance countries is that their healthcare systems are less successful in finding and treating curable cancers.

An interactive Excel workbook of the indicators and scores is available (here) by country and can produce comparative maps like that show below for tobacco control policies.

Sources: Image;  AIHW Deaths in Australia 18 Jul 2018, Figure 4.2; WHO International Agency for Research on Cancer 

The State of Play

At the time of federation in 1901, health was not a public policy topic. The new Australian Constitution granted the Commonwealth responsibility for quarantine, under s 51(ix) and for ‘invalid and old age pensions’ under s 51(xxiii). However, by 1945 the situation had changed, with health firmly on the political agenda. Consolidation of the welfare state principle in most democracies, galvanised by the suffering and sacrifice of WWII, created governments compelled to provide basic care for all their residents.

In 1946, the Constitution was amended granting the Commonwealth power to make laws with respect to health among others (1). Under s 51(xxiiiA), the Federal Government assumed power over social services, including ‘pharmaceutical, sickness and hospital benefits, medical and dental services (but not do as to authorize any form of civil conscription)’ (2). The various Acts that followed established the Australian health care system of today.

The states have power over hospitals and other services without the financial resources to fully fund those services, whilst the Commonwealth has funding capacity unmatched by the power to regulate the services it finances.’  Wheeler 1995

‘These divisions render coherent policy making, even at the state level, almost impossible.’ Duckett2004

The Commonwealth is financially the prevailing force, receiving over 80% of all tax revenues collected in Australia (State and local government taxes and levies accounted for the other).

Looking at New South Wales (NSW), in addition to the revenues it collects, the state receives grant revenue from the Commonwealth Government (including GST payments, National Agreements and National Partnerships) forecast to be around $32.5 billion in 2018-19, out of total state revenue of approximately $80 billion.

Health (28.6%, $22.9 billion) is the largest Recurrent Expenditure group for the NSW Government in 2018-19.  This is not the case with Capital Expenditure with transport representing 56.5%, and health a distant second at 12.5%. Those stadiums don’t rate costing only 2.2 billion!

The charts below relate specifically to the NSW Health Budget showing the proportion of spend by anticipated outcomes. Hospitals predominate in both. In yesterday’s state election, the  incumbent’s campaign claimed to have invested nearly $10 billion in health infrastructure since coming to office in 2011, with another $8 billion committed over the next four years.

Notes:

(1) Other sources of Commonwealth power include: s 96 (the power to make special purpose grants); ‘insurance’ (s 51(xiv)), the corporations power (s 51(xx)); the defence power (s 51(vi)); and, as amended by the referendum of 1967, s 51(xxvi) which empowers the Commonwealth to make laws for the benefit of Indigenous Australians’. Griffith 2006

(2) This conscription statement is the origin of the differences between Federal Government payment systems for PBS and MBS.

References available on request.

Evidence-Based Policy Making

Those working in the pharmaceutical industry are very familiar with evidence-based medicine (EBM) and evidence-based decision making for reimbursement. As such, we have come to expect that therapeutic and funding choices will be made following a systematic assessment of the available data. In the public policy arena however, that there can, and should be, a direct link between ‘the evidence’ and policy decisions is somewhat more problematic. Research (limiting to scientific research in this context) and policy worlds are very different.

Priorities and outcomes

The purpose of research is to advance knowledge, while policymakers want practical solutions. The research available may not necessarily be what policy makers want. From a design perspective, while control arms and blinding are de rigueur for scientific research, it may not be ethical or even possible to test political subjects using these methods. Until recently, access to operational data held by Government agencies was often difficult for researchers. Scientists rewards are focused on quality and resulting publication, less so on how findings may contribute to the public good.

Timing

Policy is delivered continuously. Demand for research is unpredictable and sporadic, with Government officials and politicians looking for it at particular moments – during campaigns, after scandals, failures, changes of leadership. Researchers must anticipate, and be ready with completed studies. However, research timelines are often long, with funding and approval lead times that make them quite unresponsive to spikes in demand. So the needed research is often not available at the time when it is required. Unfortunately, the constant shifting sands of politics may also make a well-constructed study obsolete before it even gets started.

The recent call by the Minister of Health for a reformatting of, and improved access to, Consumer Medicines Information (CMI) is one of those cases where the research has been done. Prompted by similar discussions in 2016, and ongoing efforts by industry to move away from the burdensome requirement for pack-based copies and the associated version issues, relevant data and consensus building has been undertaken. This is the ideal scenario, where the relevant policymaker or stakeholder can immediately send the Minister’s office a brief outlining a preferred solution.

A matter of perspective

Although you will see the term ‘evidence-based policy making’ (EBPM), the Blair UK and Rudd Governments were proponents, generally, it is considered aspirational, rather than a good description of the policy process. Those on the research side, may allege that policymakers ignore, do not understand nor act on the correct evidence. Why don’t policymakers select the most effective, evidence-based solution? This is because they are interpreting ‘evidence-based’ from the same frame in which they view scientific data.

Conversely, those familiar with policy making know what a messy process it can be, and have no expectation that evidence-based policy making will be solely reliant on data. It is an overarching term that refers to the consideration of a broad range of research evidence (from general public and other stakeholders; and evidence from practice and policy implementation) as part of a decision-making process that also incorporates other relevant factors such as political realities, and public sentiment.

As in science, the availability of policy research can also be fraught, especially if those in the debate are not skilled in the use of evidence, or it is presented selectively. For example, the advocacy for access to medicinal cannabis on the basis of a small number of patients successfully treated, when the scientific evidence is insufficient on which to base a treatment benefit:risk decision. In this case, other factors including Federal party politics and potential economic gains for the states contributed to policy decisions.

A matter of approach

While science is based on rational thinking, policy literature refers to a concept known as ‘bounded rationality’, jargon that describes what really happens when policy makers have ‘unclear aims, limited information, and unclear choices’.  The term may come in handy next time you need to explain what turns out to have been a poor decision! Perhaps a new synonym for ‘uncertainty’? Policymakers use imperfect, and often ‘gut’ or emotion-based, short cuts to gather information and make decisions within a complex political environment.

Hence, it is unlikely that the robust scientific research which supports the development and introduction of a new medicine will be used in the same way when constructing public policy. While evidence plays a part in what is considered ‘good policy process’, it is in no way the whole show.

References available on request. Picture source

A universal dental benefits scheme?

Dental health is an important component of personal well-being. Poor dental hygiene, apart from making unpleasant company, has been reported to be linked to higher rates of systemic disease. In an almost 40-year prospective cohort study of Swedish adults, Wilson and colleagues (2018) concluded that poor oral health is associated with a slightly increased risk of myocardial infarction. However, they caution that the results may partly be explained by residual confounding, in particular to tobacco smoking.

Closer to home, the Australian Dental Association’s Oral Health Tracker (February 2018) makes for sobering reading with 15.5% of adults reported as having inadequate dentition (< 21 teeth); 25.5% with untreated tooth decay and only 51% brushing twice daily with fluoridated toothpaste. This last figure is 68.5% in children aged 5-14 years but even so, 23.5% of this age group have already experienced decay in their permanent teeth.

The most recent AIHW report on oral and dental care in Australia notes that total expenditure on dental services (except those in hospitals) was $8.7 billion in 2012–13. This was an increase of approximately 46% (adjusted for inflation) over the decade from 2002-03. Assuming a similar growth rate, this figure may be, conservatively, around $11 billion in 2019-20.

Who pays for dental services?

In 2013, the largest source of funds for overall dental expenditure was individuals, paying directly out of pocket for 58% of total dental costs.


Of the 55% of Australians with dental coverage through their private health insurance, less than 10% of services were fully covered. The graph shows benefits paid for various extras services by private health insurers on a quarterly basis (APRA PHI Statistics). Dental services are clearly a pressure point and patient co-payments must be rising at a similar trajectory.

The Commonwealth Government can be said to contribute their part via the Private Health Insurance rebate (estimated to reach $6.5 billion by 2019-20). Additionally, a National Partnership Agreement on Dental services for Adults will provide approximately $316 million dollars to the States/Territories under the medical services sub-function for the same period. This infers that the States/Territories currently fund the bulk of public dental services.

A Child Dental Benefits Schedule (CDBS) was introduced by the Federal Government in 2014 for children aged between 2-17 years whose family receives Family Tax Benefit Part A or a relevant Australian Government payment. Interestingly, in the 2018-19 Budget, expenses for dental services are forecast to decrease by 7.0 per cent in real terms over the period 2018-19 to 2021-22, reflecting lower growth in utilisation of the CDBS. Potentially, this is a result of ongoing changes to the scheme, up to version 7.0 as at 1 January 2018.

The Australian healthcare system is acknowledged for its universality, structured around the 3 pillars of public hospitals, Medicare and the Pharmaceutical Benefits Scheme (PBS). A fourth, the National Disability Insurance Scheme (NDIS) is being established. By 2019-20, these will represent 4 of the top 8 program spends for the Commonwealth Government, budgeted at $22.3, $25.5, $11.7 and $20.7 billion, respectively.

In such an environment, the fact that 30% of Australians currently go without regular dental care due to cost, unavailability of services and other barriers, seems like a blind spot.  If dental health is a general indicator of personal health care practices, establishing good routines early in life may contribute to better overall population health. Isn’t that worth paying for?

The Final Report of the National Advisory Council on Dental Health (2012), established by the then Minister for Health and Ageing, the Hon Nicola Roxon MP and Senator Richard Di Natale, to answer this exact question, definitely thinks so. Dental policy options to achieve universal access are detailed and waiting…

Source: Cartoon, Donkey, from the Shrek movies.

Private Health Insurance in Australia

The foundations of the modern Australian Healthcare System are three publicly-financed programmes:  Medicare, Pharmaceutical Benefits Scheme & Public Hospitals. However, private health services are an increasingly critical piece of the infrastructure, with approximately 40% of hospital admissions during 2016/17 occurring in the private system. Although not mandatory, such services can be funded through private health insurance (PHI).

The benefits of PHI include choice of doctor, assistance with the cost of treatment in a private hospital, and the cost of ancillary treatments not covered by Medicare such as dental, optical and physiotherapy. The median waiting time for elective surgery for privately insured patients has been reported to be approximately half that of public patients, at 20 and 42 days, respectively.

The PHI policies currently on offer contain a bewildering combination of benefits, co-payments, exclusions and restrictions depending upon the premium paid. Ambulance transport is usually covered, importantly as a trip may be free in some states/territories of Australia but only for ‘medically necessary’ journeys in others, or not at all.

A recent Choice review looked at free online insurance comparison websites purporting to assist consumers to select the most appropriate policy. They found that ‘free’ comparison sites may actually earn fees that make up a sizeable proportion of total premiums. Some sites only compared  part of the market, while others were owned by the insurance companies they were comparing!

Membership woes

In June 1974, around the time of introduction of universal healthcare, a peak of 78.4% of the Australian population held private hospital insurance cover. At the end of June 2018, this figure was 45.1%, with 54.3% holding ancillary/extras or general cover (ambulance at a minimum). The policy trials and tribulations of maintaining private hospital cover levels are clearly shown in the graph.

Source: APRA Quarterly PHI Statistics 

The 2011 National Health Reform Agreement allowed patients with private hospital insurance entering a public hospital to choose whether to be admitted as a public or private patient. This led to an increase in the proportion of public hospital activity funded through private health insurance. Data shows that while 1 in 12 admissions to a public hospital in 2006–07 were under PHI, this figure increased to 1 in 7 during 2015–16 (AIHW 2017) suggesting that public hospitals were encouraging patients to use their private cover. Subsequently, negatively impacting the cost of PHI premiums and public hospital waiting lists.

As policy holders uptake of medical services and the cost of treatments and procedures both rise, premium affordability is becoming an issue. The trend is away from PHI membership as premiums continue to increase year-on-year at twice the rate of  inflation in an environment of low wage growth. Younger members, who are less likely to claim, are dropping cover (refer graph) leading to the question being asked: how can PHI funds be sustainable and afford to pay (ageing) members’ claims into the future?

Further Policy Reform

In October 2017, the Government announced a significant reform package, aimed at addressing some of the issues described. Successful implementation and adoption of these reforms will be essential to maintain the existing levels of service provided by the healthcare system.


For more detail, see the Parliamentary Library’s ‘Private Health Insurance: a quick guide’ by Amanda Biggs, Social Policy Section (Research Paper Series, 2017–18, 4 August 2017)

Meme source: King Julian Madagascar

Primary care organisations in Australia

The development of primary care organisations since the 1980s is based on evidence that a well-developed primary care model improves health outcomes and cost-effectiveness in the whole healthcare system. A key being their increasing use to implement public health care reforms including shifting services away from hospital settings and into the community.

Primary healthcare in Australia is provided mainly by independent general practitioners (GP) on a fee-for-service basis, predominantly funded by the Australian Government through Medicare. Over 80% of GP services are bulk-billed, with the doctor accepting a Government reimbursed schedule fee as full payment. There is no system of patient registration with a GP or practice, and patients may consult any GP.

The first major structural reform in Australian primary care was the establishment of Divisions of General Practice from 1992.  At their zenith, there were 119 nationally with 94% of GPs as members. Additional reforms included a practice incentive programme to improve quality and accountability of GP services such as paying for immunisations and prescribing reviews; a rural incentives programme that includes paying GPs to relocate to and stay in rural and remote communities and outer urban areas; and amendments to the fee schedule that encourage participation in care planning and case conferencing and more multidisciplinary care.

In 2008, the then Labor government established the National Health and Hospital Reform Commission (NHHRC) to conduct a comprehensive review of Australia’s health system. The final report  gave rise to the Council of Australian Governments’ (COAG) National Health Reform Agreement (2011). The Commonwealth Government agreed to fund a new primary healthcare structure to improve coordination and integration of primary health care in local communities, address service gaps, and make it easier for patients to navigate their local health care system.

The establishment of 61 Medicare Locals across Australian regions aimed to strengthen the primary care system (and thereby relieve pressure on hospitals and other acute providers). Medicare Locals were non-profit companies selected after a competitive application process and funded largely by the Commonwealth with $1.8 billion for the period 2011–12 to 2015–16.

Many GPs saw the new structures as a threat to their primacy in their local primary care market and an unnecessary additional layer of bureaucracy. This negative view was reinforced by the Australian Medical Association, that lobbied the Coalition Opposition on the basis of the perceived threat to the GP small businesses.

Not surprisingly, soon after coming into office, the new Minister for Health, Peter Dutton, announced a review of Medicare Locals. Conducted by Professor John Horvath, assisted by two consulting firms, the review informed the 2014-15 Budget announcement that all Medicare Locals would cease operation on 30 June 2015 and a new network of Primary Health Networks (PHNs) would be established.

Despite the significant costs associated with winding up the relatively recently established Medicare Locals, and a poorly managed public tender process, on 1 July 2015, 31 PHNs, funded by approximately $900 million, replaced the Medicare Locals.

PHNs are independent organisations funded by the Australian Government. They work collaboratively with local hospital networks (LHNs), and their boundaries closely align. Each PHN is overseen by a board. The board is advised by a GP-led clinical council and a community advisory committee.

The new PHNs are responsible for populations and geographic areas that are much larger than those of the Medicare Locals. While Medicare Locals had an average population of 355,000; PHNs service an average population of 738,000.

An example snapshot of Tasmanian PHN is provided. Refer to the PHN website for further information and links to individual PHNs.