Globalisation and the pricing of biopharmaceuticals

As the Sponsor of a new medicine seeking listing on the national Pharmaceutical Benefits Scheme (PBS), pricing used to be relatively straightforward once a positive Pharmaceutical Benefits Advisory Committee (PBAC) recommendation had been received.

The Pharmaceutical Benefits Pricing Authority (PBPA), defunct as of 1 April 2014, would determine the price based on: (1) PBAC advice accompanying the recommendation and, (2) the Sponsor’s pricing submission. Calculation methods were explained in the PBPA Manual (last edition 2009) and, sometimes further discussion with the Pricing Section of the Department of Health (DoH) was required to finalise, for example, exact amount of cost offsets etc. From a company perspective, as long as you stayed above the specified ‘global floor’, the local price was a matter for the local affiliate.

Prior to August 2007 reforms, when the PBS was split into two formularies (F1, F2) based on the availability of a generic brand following lost of exclusivity, the ‘reference pricing method’, was most commonly used. This is where drugs are priced based on their relative safety and efficacy, as determined by the PBAC and documented in Therapeutic Relativity Sheets. Where drugs are considered to be of similar efficacy and safety, the lowest priced brand or drug sets the benchmark price (‘cost-minimised’).

The ‘cost plus method’, where a gross margin of 30% is considered reasonable based on costs declared by the Sponsor in the PB11b form, became applicable to a larger range of drugs (F2, multiple brands) after the reforms, with reference pricing only applying to F1 (single brand, on patent) drugs.

A Price Disclosure policy was introduced for F2 medicines. This was necessary for the Government to realise the savings when generic brands cost-minimised to originator brand prices. Generic companies were using the excess margin above cost, due to lower development investment, to incentivise prescribers and pharmacists. Various iterations to price disclosure processes have been extremely effective in finding the lowest viable price. This policy is almost wholly responsible for over 30% of PBS services currently being below the general patient co-payment ($40) and in no need of Government subsidy.

Continuing adjustments to policies and Health Technology Assessment (HTA) evaluation guidelines maintained Government pressure on prices and risk mitigation. This resulted in the need for Special Pricing Arrangements (SPAs) and Risk Share Agreements (RSAs), respectively. Rebates of 100 % are now the norm. When ‘effective’ (i.e. real) prices being paid for new medicines are lower than the global floor these must be confidential otherwise long delays to PBS listing are likely. This is because of the increasing number of countries who base their local drug prices on those paid by a basket of countries (international reference pricing). This approach is proposed in the USA as part of the Pelosi bill.

Where a comparator is listed under a SPA, preparing an economic evaluation has become a guessing game as to the effective price. Needing to use the published list price disadvantages a new medicine in the evaluation process.

Things became more complicated when the PBS Access and Sustainability Package, introduced in mid-2015, included a 5% price cut to all F1 brands listed for five or more years. As the Table shows, F2 is a smaller source of potential savings for the Government. Anniversary cuts were extended to include 10 and 15 year listing marks as part of the 2017 Commonwealth-Medicines Australia Strategic Agreement.
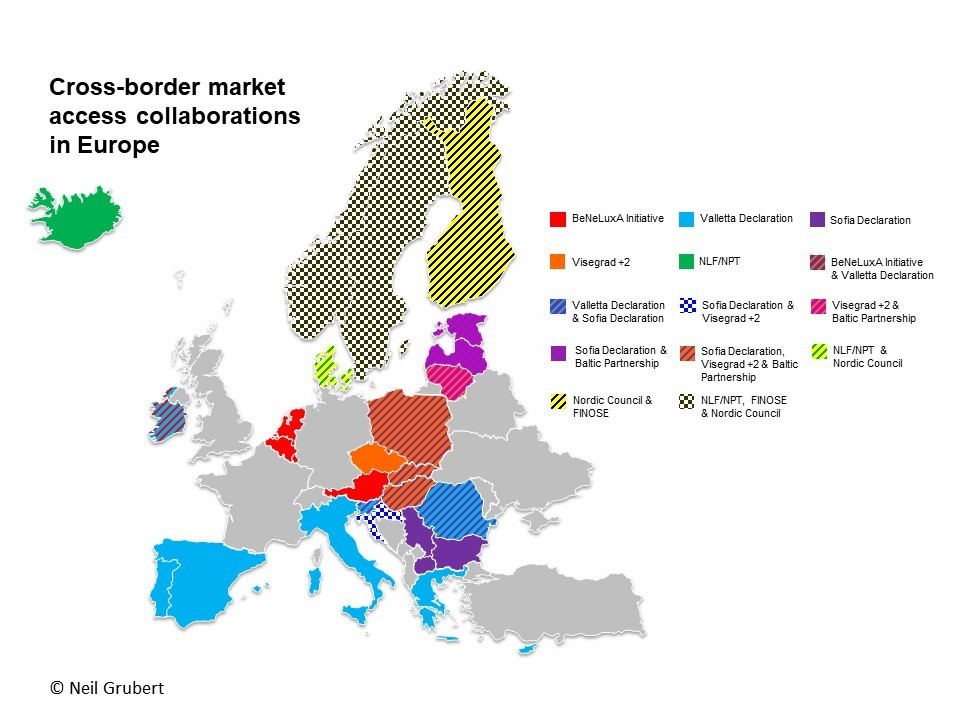
Affiliate pricing of a new medicine is increasingly centralised by companies as Government payers push to use taxpayers’ money wisely. In both situations, prices expected, based on perceived and relative value, may be very different to those modelled on the available clinical evidence.

Collaboration between payers and pressure for reform (2), including transparency of real prices, may result in pricing becoming very simple if companies choose to set only one global price.

(1) Impact of introduction of value-based pricing in Germany (2) See articles by Neil Gubert on cross-border collaboration and the Commonwealth Fund on drug pricing reform.

Photo source: BIG Maze, National Building Museum, Washington DC, 2014

Healthcare Buyer Beware

First screened at the Tribeca Film Festival in April 2018, and still available on Netflix, The Bleeding Edge is a documentary that could have easily been made about any sector of the health care industry.

No medical intervention is without risk, and although informed consent includes a discussion of potential negative outcomes, health consumers are invariably in no position to make an informed decision.

Firstly, they do not have the requisite medical knowledge, and no amount of internet searching can substitute for formal education and clinical experience in a field. Secondly, objectivity must be affected when a health issue is impacting an individual’s quality of life to the extent that he/she is considering something invasive, be it a medicine or procedure.

Consumers are encouraged to ask questions, and seek a second opinion. However, when you may have already waited months for an appointment, and then paid a substantial out of pocket for the consultation, it takes courage, as well as time and money, to seek the opinion of another medical specialist. This is a very real situation for patients, as confirmed by the Australian Government Department of Health’s newly launched Medical Costs Finder website, and as reported in the media last week.

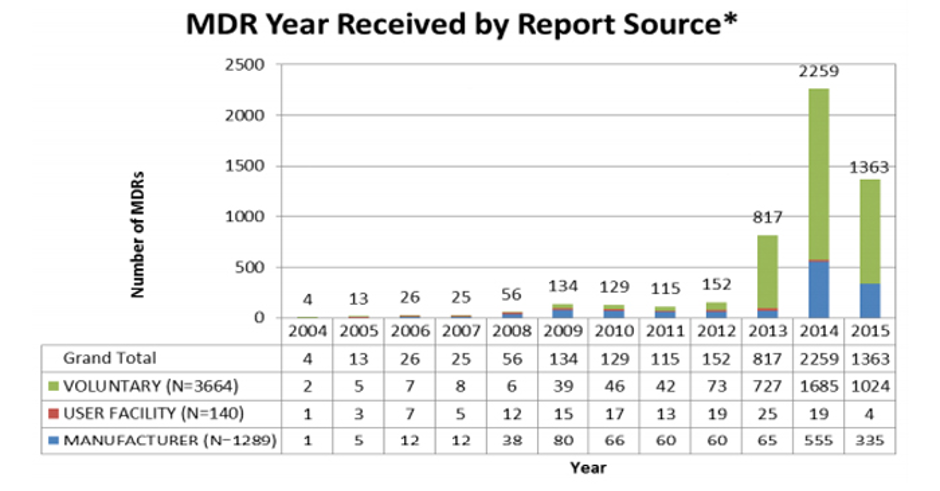
ESSURE Medical Device Reports (MDR) to FDA during post-market surveillance^

For those who have missed seeing the documentary, it explores Bayer’s permanent birth control device Essure, Johnson & Johnson’s transvaginal mesh, the Da Vinci Surgical System, and chrome-cobalt hip-replacements. Patients who have experienced adverse effects are followed as they try to regain their health; search for answers; support others; and make efforts to raise the alarm. Unlike scientific data, the film personalises and, despite the MedTech industry viewpoint, it clearly shows what ill health, irrespective of the cause, can do to a person’s life.

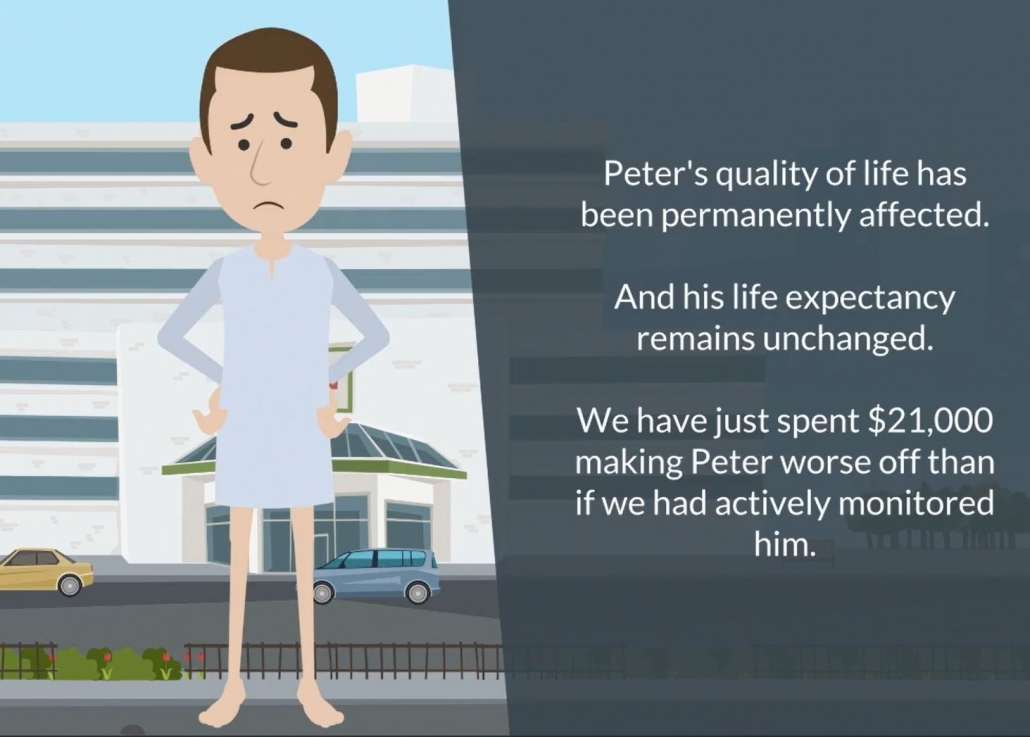
The documentary also highlights how an intervention can be experienced very differently depending on your perspective. This issue is illustrated using PSA levels as the basis for prostate surgery in a 2018 video on value-based healthcare produced by the Metro North Hospital and Health Service in Queensland. Over diagnosis of prostate cancer and over servicing with prostatectomy are well documented. Urinary incontinence and erectile dysfunction are frequent side effects that are debilitating for patients, while from the health sector viewpoint, the treatment has been a success (see screen shots from the video).

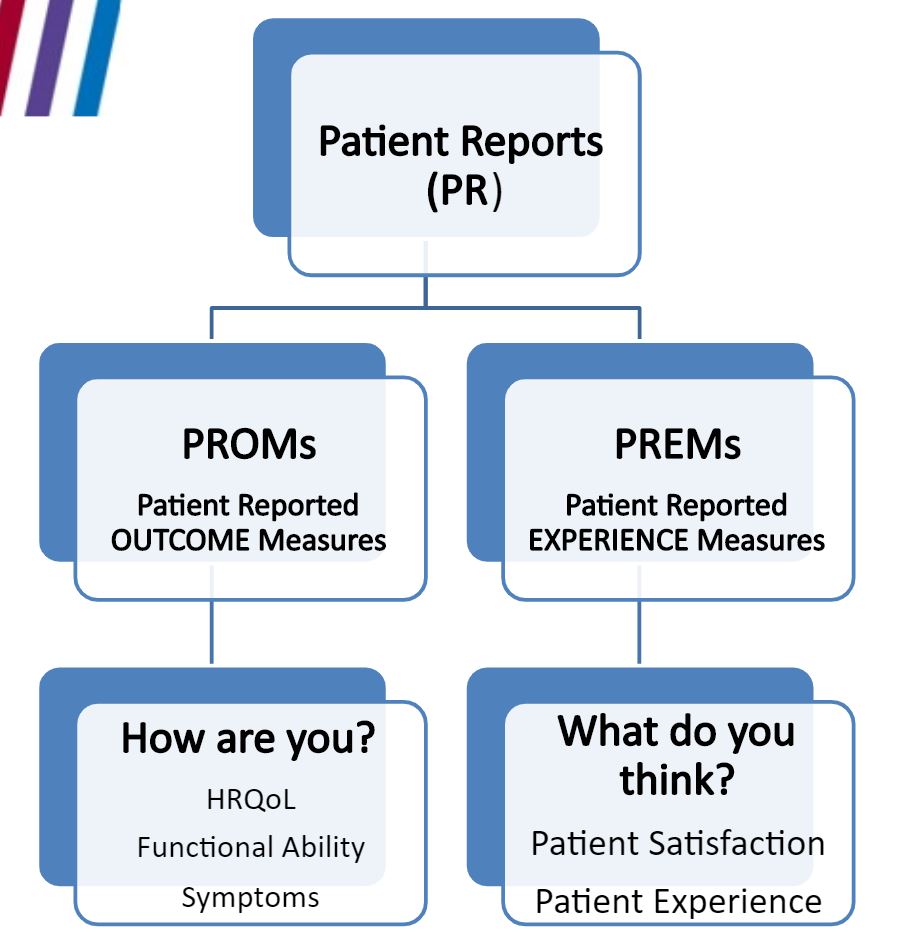
This disconnect is behind increasing calls to integrate patient feedback into clinical practice by use of Patient-Reported Outcome Measures (PROMs) and Patient-Reported Experience Measures (PREMs) (see figure).

A concern focused on in the documentary is the lack of evidence required for medical devices to be approved for marketing in the US. The FDA’s 510(k) pathway enables medical devices to be approved if the manufacturer demonstrates equivalence to a device already on the market. This is considered less rigorous than the standards that apply to new medicines.

Patient Reported items (Source)

Parvizi and Woods (Clinical Medicine 2014;14(1):6-12 ) compare and contrast regulations for medicines and devices and explain that differences are a function of the nature of the challenges in defining and monitoring the safety and performance of devices under conditions of use. Namely, the large number of types of medical device in use; short timelines of innovation with a medical device typically changed by incremental steps every 1–2 years; and the main causes of adverse incidents being sporadic manufacturing faults, long-term wear (particularly in the case of implants) and operator factors.

The Therapeutic Goods Administration (TGA) is responsible for medical device approvals in Australia. Compliance with a set of Essential Principles (EP) for the quality, safety and performance of a medical device is required to be demonstrated by manufacturers to achieve marketing approval (ARTG listing). The rigorousness of requirements depends on classification of risk level for different classes of device. For example, for surgical retractors classified as low risk (Class I), a sponsor can self-certify that their product meets the EPs.  Active implantable medical devices (AIMD), such as pacemakers and those include medicines, tissues or cells, are the highest risk and must be assessed in full by the TGA.

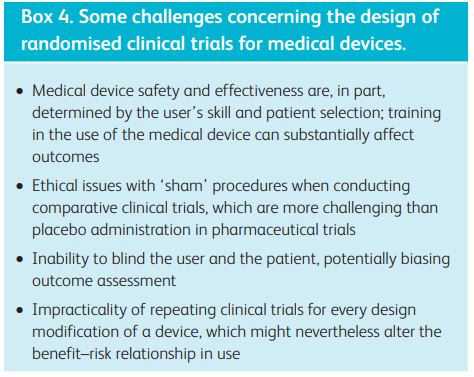
EP#14 Clinical evidence states:“Every medical device requires clinical evidence, appropriate for the use and classification of the device, demonstrating that the device complies with the applicable provisions of the Essential Principles.” It is acknowledged that in some circumstances clinical investigation data are not available or are insufficient in quantity or quality (see Box 4 from Parvizi and Woods 2014). In this situation clinical investigation data from a ‘substantially equivalent’ device such as a predicate or similar marketed device may be used to support the safety and performance of the device under assessment.

In response to public concerns, the TGA published an overview of regulation of Medical Devices in late 2018. It includes that “The TGA has only recently started accepting US FDA 510k approvals to support applications for some implantable medical devices, and these applications are being subjected to further scrutiny by us to ensure that devices that use this pathway are meeting Australia’s requirements.”

Risk benefit evaluations are an ongoing conundrum for health consumers. Until the equation can be communicated with clarity, the same warning must apply as with any other purchase, caveat emptor.

Note: A week prior to the film release in 2018, Bayer removed the Essure birth control device from the U.S. market. The Essure contraceptive device was cancelled from the ARTG on 9 February 2018. Since the device began supply in Australia in 1999 until 6 August 2018 the TGA received 59 adverse event reports relating to women implanted with the Essure device. The reports included changes in menstrual bleeding, unintended pregnancy, chronic pain, perforation, migration of the device, and allergy/hypersensitivity or immune-type reactions. Surgery, including hysterectomy, was required in some instances to remove the device.

^Source

It’s almost MMXX!

Yes, 2020; a Leap year; summer Olympics; US Presidential race; and UN International Year of Plant Health!

Whatever is forecast with respect to Australia’s weather and economy in the coming year, here are a few predictions that haven’t quite come to fruition (Courtesy of BestLife):

  • In 1937, Nikola Tesla predicted that “within a century, coffee, tea, and tobacco will be no longer in vogue.” His idea was that “it will simply be no longer fashionable to poison the system with harmful ingredients.”  Tobacco, yes; but coffee, definitely not!
  • A 1951 edition of the magazine Popular Mechanics was confident that every family in the 21st century would have at least one helicopter in their garage. This guy in Cincinnati has achieved it!
  • In 1900,  John Watkins Jr., a curator at the Smithsonian Institution, predicted that by the 2000s, “there will be no C, X, or Q in our everyday alphabet. They will be abandoned because unnecessary.” This was before Alfred Butts invented Scrabble in 1938!
  • However, for those familiar with the habits of teenagers, in one facet, Watkins was accurate when he noted that people would only communicate with “condensed words expressing condensed ideas.”

On a serious note, the past decade has seen the Australian Pharmaceutical Benefits Scheme effectively flat-line at AU $11 Billion (US $7.45 B) per year in real dollars. This is despite the upward pressures of the listing of multiple innovative products, especially in the oncology and infectious disease areas; increases in service numbers associated with an ageing demographic; and 50% of the population managing a chronic condition. Forces pushing expenditure down have included highly effective pricing policies, in particular following loss of patent exclusivity; approximately 30% of prescriptions being self-funded as the cost is below the indexed co-payment threshold; and down-scheduling of products to over the counter and off the PBS.

While this stagnation is of concern to those whose livelihood depends on the PBS, i.e. manufacturers, other suppliers, wholesalers, community and hospital pharmacies; in political terms, the majority of the sector has been neutralised. Only retail pharmacies, and a successful negotiation of the 7th Community Pharmacy Agreement (7CPA) stand between the Commonwealth Government and budget control of the program. New and amended listings are carefully added for maximum political capital, with only those in the background appreciating the full extent of the delays to patient access.

Further policy initiatives should be expected in 2020 and beyond to make up the short fall in savings to Government committed to by Medicines Australia in the 2017-2022 Strategic Agreement (SA). Savings of AU $1.8 Billion (US $1.22 B) are to be delivered for reinvestment into listing of new medicines, however the delay in entry of Humira biosimilar competition has left a significant gap to date. The Government may make trade-offs between the Industry and the Pharmacy Guild, representing owners of Australia’s 5,700 community pharmacies, and the Pharmaceutical Society of Australia (PSA), particularly around services focused on ‘Medicines Safety’ as the 10th National Health Priority.

Other activities to expect locally next year:

—-My blogging companions—-
  • Review of the National Medicines Policy;
  • Roll-out of Tranche 2 of PBS Streamlined Process improvements;
  • Impact of full Cost-Recovery to take effect from 1 July;
  • Introduction of electronic and active ingredient prescribing requiring clinicians to take extra steps to prescribe a specific brand;
  • Further biosimilar uptake initiatives;
  • Continuing formalisation of consumer and patient input to steps in product R&D and Market Access;
  • Activity around proposed changes to the Supply Chain, which have not progressed in 2019. This has the potential for global impact in terms of price transparency and product access.
  • Increasing patient activism in New Zealand.

Thank you for your patronage during 2019.

Surviving Community Pharmacy

As the purchasing of medicines moves towards a commodity model in Australia, with off-patent (F2) molecules a marketplace, and ‘me too’ R&D programs and associated payer behaviour creating as much in the patent (F1) space, providers all along the supply chain are being impacted.

What are Community Pharmacists, as one of the key groups affected by stagnation of the PBS, doing to remain viable?

Community Pharmacy Programs and Services

The first Community Pharmacy Agreement (CPA) in 1990 between the Commonwealth and the Pharmacy Guild, representing pharmacy owners, introduced a new remuneration framework for pharmacies supplying PBS medicines and created incentives to optimise the distribution of pharmacy services around the country.

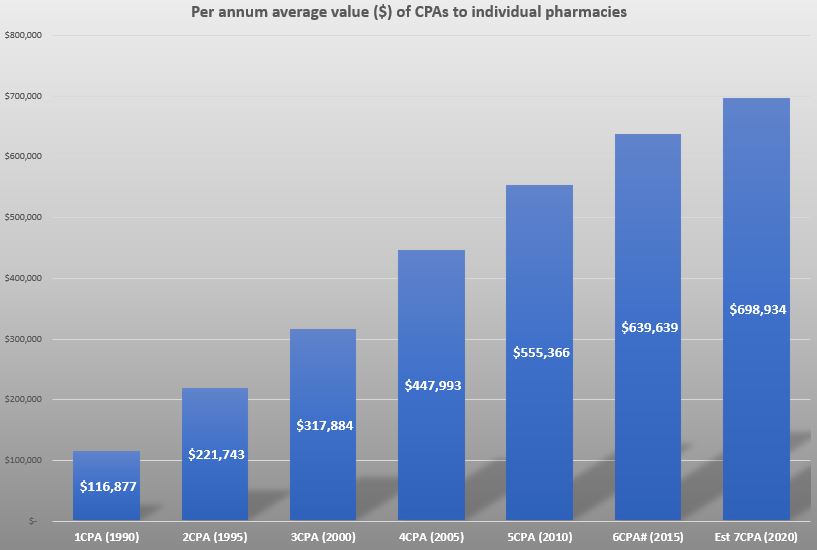
Specific programs and services appeared in the third CPA from 2000, and subsequent CPAs have included an ever-increasing number of remunerated clinical activities. These still represent a small proportion of the overall value of the agreement, but offer more revenue with no increase in costs. Hence, in addition to retaining existing components, such as 30-day dispensing, expansion of service programs are a key feature of negotiations of future agreements. Figure 1 shows the average annual dollar amount a pharmacy can expect to generate from the components of each CPA.

Figure 1. Actual Expenditure minus CSO from 3CPA onwards, divided by number of approved pharmacies. Note: Pharmacies purchase PBS items as stock and only claim this cost back from the Government following dispensing. # not including additional $600 million committed as part of Pharmacy Compact 2017. Sources: AIHW, DoH, ANAO, Pharmacy Guild.

This is despite continuation of Government payment for programs being contingent on demonstrating clinical and cost-effectiveness. A 2017 evaluation by HealthConsult was unable to make conclusive assessments on the benefit of Dose Administration Aids, Staged Supply, MedsCheck, Diabetes MedsCheck and Home Medicines Reviews conducted by pharmacists due to a lack of robust data. Further research is required in this, currently, evidence free zone.

The Pharmacy Guild and Instigo initiated the Health Advice Plus program in 2016 to assist pharmacies to maximise the opportunities and revenue afforded by the CPA programs. Based on 1,000 pharmacies, they recently reported that, of those pharmacies : 87 % have a private consultation room; 44 % are maximising their clinical Intervention potential; only 28 % are maximising MedsChecks with an average of 12 a month (up to 20 permitted); 56 % have not reached their DAA cap level (individually calculated based on previous 12 months); and 72 % are currently providing vaccination services.

The Aged Care Royal Commission Interim Report prompted this month’s decision by the COAG Health Council to name “Medicine Safety” as Australia’s 10th National Health Priority Area. The report also notes the need for the Federal Government, Pharmacy Guild and Pharmaceutical Society of Australia (PSA) to consider the effectiveness of the Residential Medication Management Review program and make it stronger and more accessible. A timely opportunity for pharmacy as the 7CPA negotiations continue.

From supply function to pre-primary healthcare

The Guild and PSA have recognised the need to broaden the role of community pharmacy and are actively working to expand the sectors offerings for treatment of minor aliments and preventative health (vaccinations, health checks, risk assessments, self-care, lifestyle issues).

Source: https://www.tga.gov.au/scheduling-news (accessed 301119)

From a policy and revenue perspective, this is also a sweet spot that the Government is prepared to support in the face of a healthcare system showing the strains of an ageing population, increasing prevalence of chronic diseases, higher public expectations and rising costs of new technologies. According to a RACGP report, General Practitioner workloads, inadequate Medicare rebates and decreasing numbers of graduates choosing the speciality, with numbers in training dropping by 20% year on year since 2016, will not see an improvement in the foreseeable future.

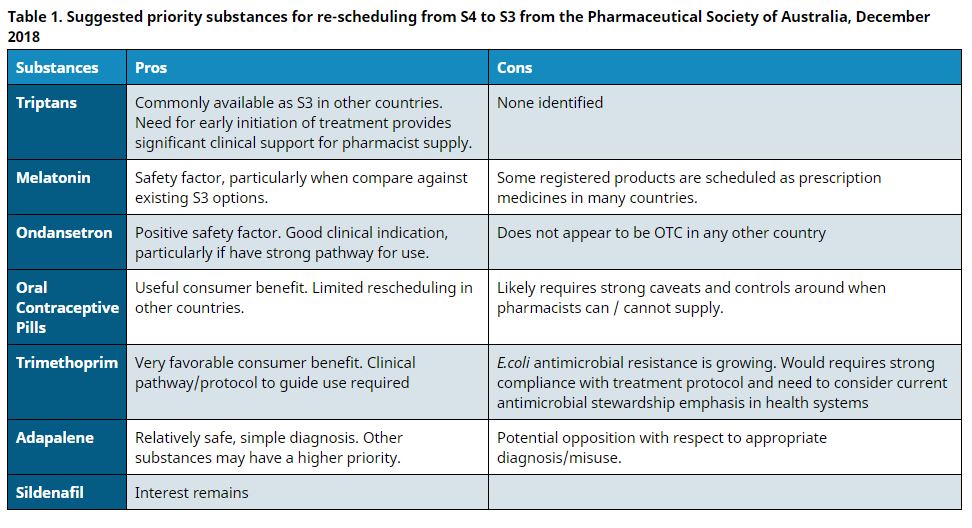
This is a gap that community pharmacy is driving to step into. One means is via down scheduling of Prescription Only medicines to Pharmacist Only (a process managed by the TGA) which has the added value to Government of reducing visits to the GP (capacity and expenditure benefit) but also the cost of these medicines moves to the patient’s pocket from the PBS (if listed). Table 1 shows the products most likely to be re-scheduled in the near future.

Meanwhile the debate about extending pharmacists’ scope of practice to include prescribing of Prescription Only medicines continues.

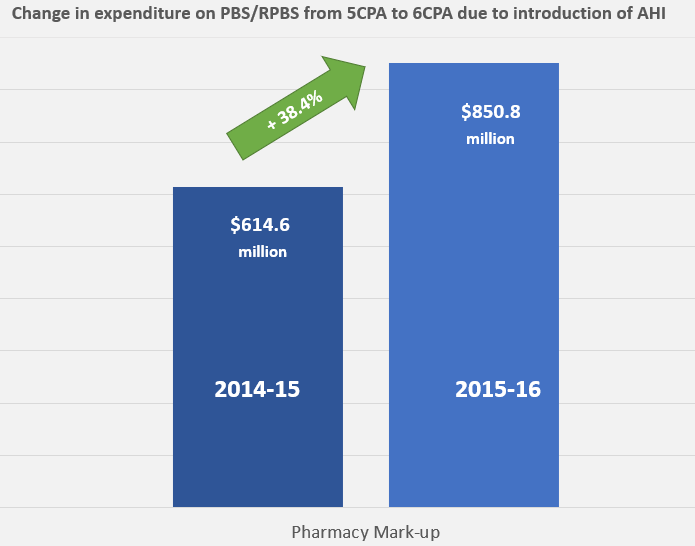
Figure 2. Pharmacy Mark-up: the increase in the pharmacy mark up between 2014-15 and 2015-16 is a result of the introduction of the Administration Handling and Infrastructure fee, replacing the previous percentage based mark-up. Source: https://www.pbs.gov.au/statistics/expenditure-prescriptions/2015-2016/cpa-exp-rpt-2015-16.xlsx (accessed 301119)

De-linking dispensing fee from medicine price

As successive Price Disclosure policies dropped the average price of many frequently dispensed former block buster molecules for chronic conditions, community pharmacies watched their revenue similarly plummet. Coupling payment for completing the same dispensing process to the price of a product was no longer such a good idea. The 6CPA moved compensation for dispensing from a percentage of product value to a flat fee. The Administration, Handling and Infrastructure (AHI) fee has stabilised the impact of price disclosure. Figure 2 shows the impact of this changeover comparing Government payment in the last year of the 5CPA with that in the first of the 6CPA when the AHI was introduced. Unlike PBS listed medicine prices, the AHI is indexed annually.

The 7CPA is due to commence in July 2020. Negotiations continue between the Australian Government, Pharmacy Guild and PSA.

Image source

3 Reasons why Medicines Shortages will continue

Mandatory reporting of medicine shortages† from 1 January this year has seen new notifications to the Australian Therapeutic Goods Administration (TGA) increase by over 400% (n=1,455 for 2018-19) compared to the previous period (n=274).  Currently, over 10% of the drugs on the TGA ‘list’ are classified as critical with the potential to have a life-threatening or serious impact on patients. 

Miljkovic N et al. Results of EAHP's 2018 Survey on Medicines Shortages. Eur J Hosp Pharm 2019;26:60-65.
Miljkovic N et al. Results of EAHP’s 2018 Survey on Medicines Shortages. Eur J Hosp Pharm 2019;26:60-65.

The FDA Drug Shortages Task Force Report, released today, compared drugs that went into shortage from 2013 to 2017 to similar drugs that did not go into shortage. Drugs in shortage were more likely to be relatively low-price, in particular genericised sterile injectables, including anaesthetics, chemotherapy and pain treatments. Australian hospital (2017) and European Association of Hospital Pharmacists (EAHP) 2018 Medicines Shortages surveys reported similar groups of drugs most often impacted (Figure 2 from the report shown).

Shortages can and do have a significant impact on patient care, especially when there is little or no notice. Required reporting provides authorities, health care professionals and patients time to prepare. Unfortunately, this measure, like those taken elsewhere in the world will not reduce the problem because:

(1) Commodity pricing policies

Treating drugs as commodities exposes them to the rigours of supply and demand.

Although demand is increasing globally, due to ageing populations and availability of more effective medicines, the FDA Task Force found ‘prices rarely rose after shortages began, and during shortages, production typically did not increase enough to restore supply to pre-shortage levels.’ This points to a ‘broken marketplace‘, where scarcity does not result in the price increases predicted by basic economic principles.

RELATION BETWEEN PRICING POLICY AND MEDICINE SHORTAGES. From https://publicaties.vereniginginnovatievegeneesmiddelen.nl/magazine/mm2019uk/medicines-for-tomorrow/

As the graph shows the relationship between introduction of a preference policy in the Netherlands, where only the cheapest medicine for a specific disorder is reimbursed, has resulted in a greater proportion of these medicines being in shortage.

Companies seeking to enter the generic marketplace may not have the manufacturing history and quality safeguards in place to ensure sustainable supply. This is despite providing guarantees to Governments who preference suppliers based on price.

The production and supply of pharmaceuticals is regulated by Good Manufacturing Practice (GMP), as prices decrease, companies may consolidate manufacturing facilities to maintain profitability. Hence, those medicines with the most competition will be the most vulnerable to shortages.

(2) Expansion of reference pricing

As more Governments, including the US (see Pelosi Lower Drug Costs Act 2019) introduce reference pricing into their drug procurement policy mix, others are losing their appetite for the quid pro quo of access to new products at ‘hidden’ prices. The Dutch Health Minister has recently called to ignore the confidentiality of pricing agreements, while the Australian pharmaceutical industry was rocked last year by the presentation of a poster listing rebates by ATC code at an international conference. In addition, changes to supply chain rebate arrangements continue to be progressed by the Australian Government despite concerns around the impact on availability of new drugs.

There is a real possibility that companies will set a price for a product and that will be the price, irrespective of country. This will restore the marketplace but patients in countries that have come to expect, and demand, substantial discounts on new medicines will be left waiting for access.

(3) Solutions to date have been ineffective

TGA Annual Performance Statistics. Table 80. https://www.tga.gov.au/book-page/15-reporting-medicine-shortages
TGA Annual Performance Statistics, 2018-19, Table 80.
https://www.tga.gov.au/book-page/15-reporting-medicine-shortages

The EAHP 2018 survey found that medicines shortages have become more troublesome since the last survey in 2014, with 91.8% respondents reporting shortages impacting patient care. The FDA Task force found that the number of ongoing drug shortages has been rising, and that their impact is likely underappreciated. Note: the FDA infographic shows shortages averted, the how likely includes requested intervention by other suppliers.

Manufacturing issues continue to be the most common reason for supply shortages. As reported in 47% of cases to the TGA in 2018-19; and 37%, plus 27% other quality issues, to FDA in 2012. Medicines are not commodities.

The FDA conclude that: ‘The root causes of shortages involve economic factors that are driven by both private- and public-sector decision-making.’

Private sector decisions serve business interests. While public sector decisions aim to benefit societal, and political, interests. The Task Force suggests quality ratings of manufacturing facilities and new contracting approaches with incentives as possible levers.

In the meantime, there will always be someone seizing the day, in this case, a plethora of global wholesalers!

Notes: † Defined as when supply of a medicine in Australia will not, or will not be likely to, meet the demand for that product in Australia any time within the next 6 months; *Reportable medicines are Registered Schedule 4 (Prescription Medicine) or Schedule 8 (Controlled Drug) products, and certain non-prescription medicines considered critical and listed in the relevant legislative instrument. Chain photo from Google Images

The PBS goes to Canada

Taxpayer funded national programs providing universal access to prescription drugs are longstanding policy in Australia, NZ and UK.

Considering the establishment of a similar program in Canada, where largely private province-based schemes* currently operate, presents an opportunity to consider what is lost when these programs are the sole focus of pharmaceutical policy.

Advocates of such schemes point to cost-effective product selection and savings generated by lower and reducing generic and brand name prices. The principles of universality, equity of access, safe & appropriate prescribing, and value for money are paramount.

The Minister of Health, the Hon Greg Hunt MP, regularly commends the foundation role that the PBS plays in the Australian health system. While such programs have reduced both overall expenditures and the average price paid per drug, like all policies, they often have unforeseen repercussions.

In her recent essay, Kristina Acri examined the potential unintended consequences of a publicly-funded national Pharmacare program in Canada. She reviewed the experience of New Zealand, Australia and United Kingdom to identify those aspects where reality has not matched the promise:

  • Drug supply is put at risk by sole tendering & reference-based pricing policies, as well as use of cost-effectiveness analysis. For off-patent medicines, seeking the lowest price within a guaranteed supply framework should protect against shortages. However, whether appropriate or not, global factors and profit seeking influence where available drug supplies are sent. Dealing with drug shortages are an increasing occurrence for pharmacists, clinicians and patients;
  • The scheme may not be universal. In Australia, 50 % of total drug expenditure is directly borne by patients, one of the highest cost-sharing rates in OECD countries after the far Northern European countries (ranging from Sweden 48 % to Iceland 58%) (OECD, 2015). Before introducing the scheme, how medications will be selected and what the costs will be to patients and taxpayers must be fully understood; and
  • The likely impacts on access, health outcomes, costs, and innovation for patients, physicians, the market and the economy should be examined.
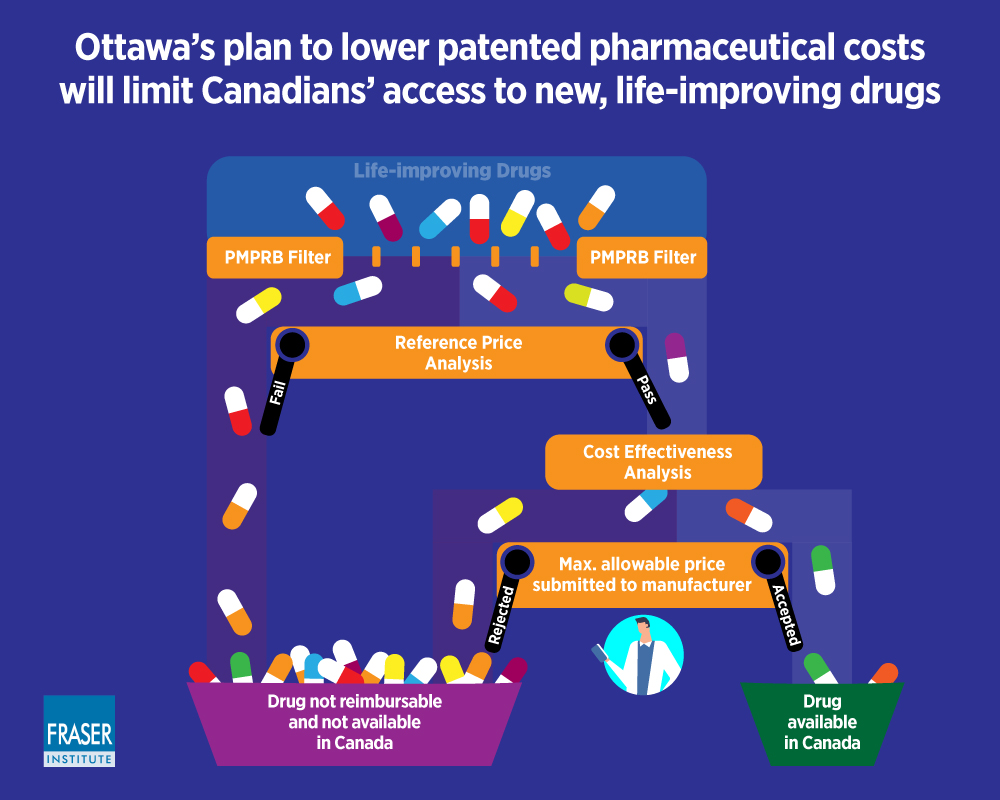
Infographic, Globerman & Barua (2019)
The Patented Medicine Prices Review Board (PMPRB) is an independent quasi-judicial Federal agency established in 1987 under the Patent Act. The PMPRB ensures prices of patented medicines sold in Canada are not excessive.

In a similar review, Crosby et al. (2016) discuss that to control spending on universal schemes, access to new drugs is rationed, downward pressure is imposed on prices, and costs are pushed to individuals. They conclude that introducing a universal scheme to Canada would increase public spending, reduce patient choice to only subsidised medicines, delay access to new drugs and lead to inequities in coverage compared to the existing situation.

Globerman and Barua (2019) discuss the impact of the Health Canada proposed amendments to the Patented Medicine Prices Review Board (PMPRB) procedures which will include the evaluation of the cost effectiveness of drugs by CADTH, into the determination of maximum allowable prices for patented drugs. They note that that these changes ‘seem to be focusing more on controlling expenditures on pharmaceuticals than on ensuring that Canadians have access to new therapies’. They advocate for an efficient level of expenditures on pharmaceutical drugs, not simply containing expenditures on those drugs.

‘In principle, cost-efficiency analysis is a technique for comparing the social benefits of a drug relative to its cost.

In practice, the conventional application of the technique arguably leads to an underestimation of the social benefits of new drugs.’

Despite these concerns, last month legislation introduced by Health Canada was passed and paves the way towards a PBS Canadian-style! ‘Government of Canada Announces Changes to Lower Drug Prices and Lay the Foundation for National Pharmacare.’ News Release, August 2019.

*A third of Canadians are covered by public drug plans which vary from province to province. Most are covered through their workplace by private insurance plans. Another 10% of Canadians have no coverage at all (Canadian Health Coalition, 2017).

References: (1) Kristina M. L. Acri (née Lybecker) The Unintended Consequences of National Pharmacare Programs. The Experiences of Australia, New Zealand, and the UK. The Fraser Institute, December 2018. Vancouver BC, Canada. (2) Steven Globerman and Bacchus Barua. Pharmaceutical Regulation, Innovation, and Access to New Drugs. An International Perspective. The Fraser Institute, January 2019. Vancouver BC, Canada. (3) Crosby L, Lefebvre C, Kovacs-Litman A. Is pharmacare the prescription Canada needs?. UWOMJ Drugs 2016;85(1):23-5.

Image source

The fate of ‘fee for service’ GP visits

Without structural change to the way in which health care is delivered and financed, the Australian health care system will continue to struggle to meet contemporary needs and expectations of its citizens.

Mitchell Institute Policy Issues Paper ‘Australian Health Services: Too complex to navigate’ February 2019

SIMPLIFICATION REQUIRED

An analysis of previous reviews of Australia’s health service was undertaken by the Mitchell Institute early this year. The authors report successive reviews concluded that existing funding arrangements impede the delivery of clinically effective and efficient health care, in particular for chronic diseases.

Consequently, the report, as those that have come before, recommends restructuring of current health financing arrangements to move the focus, and incentives, from high cost reactive healthcare towards investment in prevention services to reduce disease, as well as management of chronic health conditions.

A publicly funded universal insurance system in concert with private health insurance should be retained. However, the basis for remuneration of providers must ‘encourage sustained prevention, early detection and management of chronic disease and coordination of services to reduce duplication and more effective use of information’.

HEALTH CARE HOMES (HCH) TRIAL

It was on the basis of one such report (Dec 2015) that the Primary Health Care Advisory Group# recommended implementation of a Health Care Home model of care. The intent being provision of a ‘home-base’ (GP practice) for patients with complex and chronic conditions, where the care needed would be coordinated on an ongoing basis.

Stage 1 of the HCH program was to be trialled in 200 GP practices and enrol up to 65,000 patients (later modified to a cap of 12,000) by 30 June 2019. However, at this time only approximately 99 of the 175 registered practices were active with a total of 2,075 enrolled patients. The implementation of the pilot has been roundly criticised, with even the Royal Australian College of GPs withdrawing their support for the scheme (see August 2018 Medical Republic article).

In December 2018, the Government extended the HCH trial for an additional eighteen months to 30 June 2021. At the same time, it was announced that Health Policy Analysis (HPA), an independent organisation had been contracted by the Department of Health to undertake an evaluation of the implementation of Stage 1 in collaboration with experts from the University of NSW and the University of Technology.

Zong et al. 2019, Figure 2

In response to an enquiry, the Department of Health confirmed that this evaluation ‘is progressing well, with the second round of data collection and analysis under way‘. They also noted that ‘the evaluation has been extended to 2021, in line with the extension of the program. HPA will now deliver the final evaluation report to government late 2021. It will be a decision for government on whether to release the findings of the evaluation to a wider audience.’

IS LEGISLATION NECESSARY?

In 2012, the US State of Massachusetts enacted a law to control health care spending. This was in response to increases such that by 2010, costs of Medicaid and private health insurance for state employees accounted for almost 40% of the state’s annual budget. Key elements of the law include:

  • limiting the growth of health care spending to growth in Massachusetts’ economy as measured by the gross state product (GSP);
  • shifting from fee-for-service care to global payment models;
  • supporting the formation of Accountable Care Organisations and patient-centred medical homes to improve quality and control costs; and
  • promoting greater transparency through expanded public reporting of health care providers’ quality and cost data.

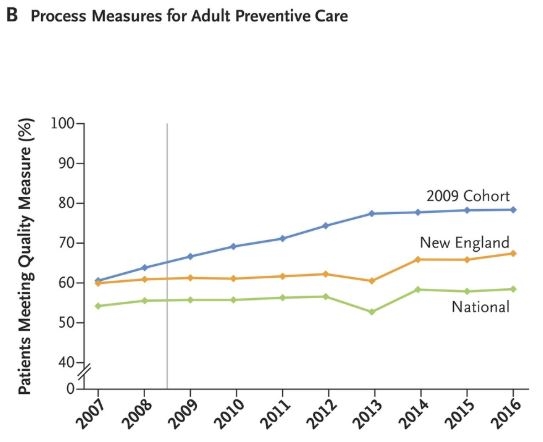
Eight-year results were reported in the NEJM in July (4), and demonstrate that global budgets and financial incentives for improving quality and controlling costs work. On a range of measures those patients treated under terms of the new law (labelled as 2009 Cohort) received better quality care compared to patients in surrounding States (in New England region), and the rest of the US (National). The graph shows the proportion of patients meeting quality standards for preventative care over time between these three groups. The grey vertical line is the introduction of the new law. Overall on the range of measures followed, patients experienced better health outcomes for less cost which must catch the attention of Ministers of Health!


# The Healthier Medicare initiative of the Abbott Government included establishment, by the then Health Minister Susan Ley, of the Primary Health Care Advisory Group to investigate options for the reform of primary health care to support patients with chronic and complex illness, including mental health conditions.

References
1. Hayes P, Lynch A & Stiffe J. Moving into the ‘patient-centred medical home’: reforming Australian general practice. Journal of Education for Primary Care  2016;27(5):413-15.

2. Song Z and Landon BE. Controlling Health Care Spending — The Massachusetts Experiment. N Engl J Med 2012; 366:1560-1561.

3. Ayanian JZ and Van der Wees PJ. Tackling Rising Health Care Costs in Massachusetts. N Engl J Med 2012; 367:790-793.

4. Song Z, Ji Y, Safran DG and Chernew ME. Health Care Spending, Utilization, and Quality 8 Years into Global Payment. N Engl J Med 2019; 381:252-263.

Image source

Death, be not proud

The release of Australian mortality data by the AIHW brings to mind Donne’s sonnet, although causes of death are no longer the ‘kings and desperate men‘ attributed in c.1610.

In 2017, there were 160,909 deaths registered in Australia, 66% among people aged 75 or over (60% males and 73% females). The median age at death was 78 years for males and 85 years for females. 

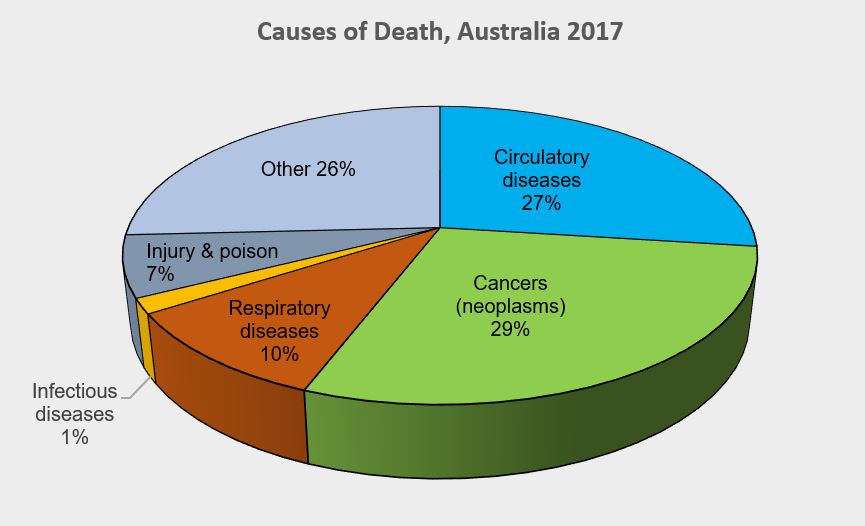
Overall, cancer (neoplasms) was the leading cause of death. At 29%, clearly easing circulatory diseases (27%) out of the top spot for the first time. The leading cause of death for males was coronary heart disease (13%). Dementia and Alzheimer disease was the leading cause of death for females (11%), followed by coronary heart disease (10%). Cerebrovascular disease (which includes stroke), lung cancer and chronic obstructive pulmonary disease (COPD) made up the top 5 leading underlying causes of death in Australia in 2017 for both males and females of all ages combined.

In 2017, the difference in death rates between the sexes was the narrowest ever recorded. The greater than 70 % reduction from a high in 1968, is considered to be due to a drop in deaths from circulatory diseases. Factors at play include improvements in medical care (surgery, diagnosis and pharmaceuticals), and lifestyle changes (smoking, diet and high blood pressure).

Child (aged 0-4 yrs) mortality accounted for < 1 % of all deaths in the period. A major improvement on the 26 % reported for 1907, however still too high for the families involved. Work continues on access to and quality of neonatal health care; community awareness of risk factors; and increasing coverage of universal immunisation programs.

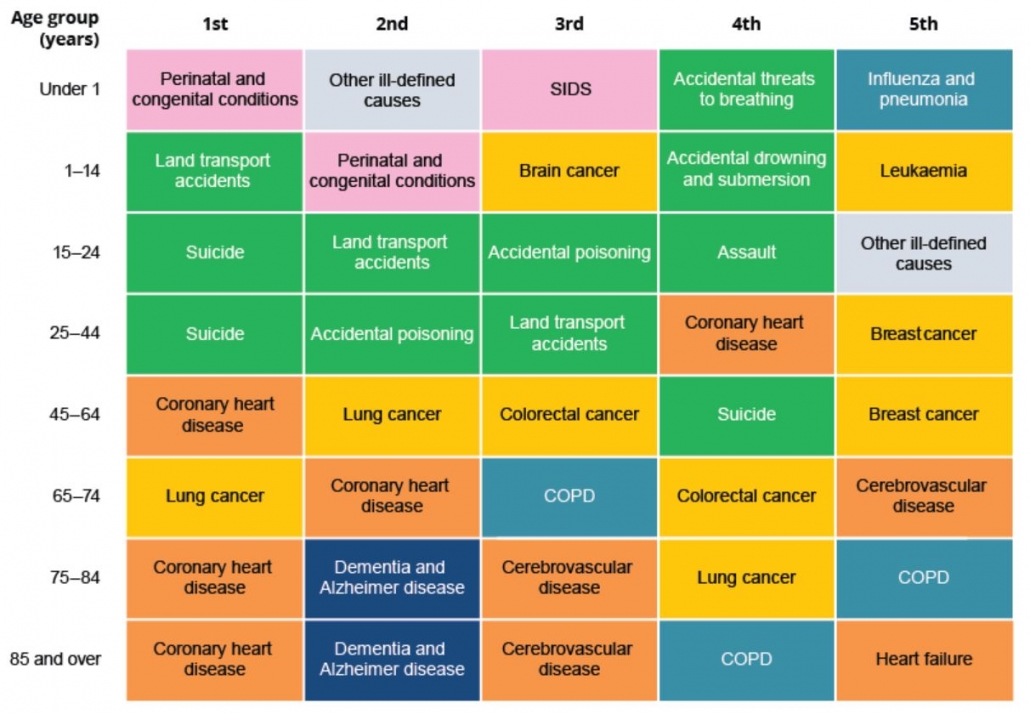
As well as differences by gender, the leading causes of death also vary by age (refer graphic):

  • Among infants, perinatal and congenital conditions accounted for 79 % of deaths;
  • Land transport accidents were the most common cause (11 %) among children aged 1–14 .
  • Suicide was the leading cause of death among people aged 15–24 (35%), followed by land transport accidents (22%);
  • For people aged 25–44, it was also suicide (21%), followed by accidental poisoning (12%);
  • Chronic diseases feature more prominently among people aged 45 and over. Coronary heart disease was the leading cause of death for people aged 45–64, followed by lung cancer;
  • For people aged 65–74, it was lung cancer followed by coronary heart disease;
  • Dementia and Alzheimer disease was the second leading cause of death among people aged 75 and older, behind coronary heart disease.
Leading underlying causes of death, by age group, 2015–2017 (AIHW Figure 3.2)

Image: An Unclean Death by Pia Guerra

In defence of Private Health Insurance?

Having been hit by the proverbial bus (#), although in my case, it was a toboggan, my recent encounter with the Australian healthcare system has left me in awe!

From the impromptu consultation with a holidaying ER specialist; the ordered chaos of the Perisher Valley Medical Centre; the administrative whiz at the Sydney rooms who got a specialist to look at my X-rays, found an early morning appointment followed by an emergency MRI slot. This on the way to the hospital to prepare for surgery, by the said surgeon who added me, along with 2 other ‘urgents’, to the list. The hospital nursing and other staff were as competent and professional. A simple thank you seems inadequate.

Once on the list, the private hospital called to inform me that my PHI fund had agreed to pay for my stay. All I would need to pay was the $450 excess (a trade-off applying to each separate admission for some fee relief). The actual admission process was reminiscent of those scenes from American movies where the parent/partner finds out the very expensive care that his/her loved one needs is not covered by insurance.

I was out of pocket every step of the way. I was well informed upfront as to what costs were likely to be involved. Except for the anaesthetist (and assistant surgeon), whom introduced themselves and then promptly injected me with a cocktail of medicines that mean I can’t remember a thing!

What is one to do in this situation? I didn’t explore the possibilities of not being able to pay the gap between what was being charged and the Medicare scheduled fee. To avoid an out of pocket I would have needed to be driven to a medical service in Jindabyne (35 km) or even Cooma Hospital (100 km) emergency department for the initial consultation and an X-ray. Is it a part of Australian folklore that everyone should be bulk billed at a GP level?

The Australia Medical Association Guide for Patients on How the Health Care System Funds Medical Care (2015) notes that:

  • ‘The Medicare Benefits Schedule (the MBS) is a list of the medical services for which the Australian Government will pay a Medicare rebate, to provide patients with financial assistance towards the costs of their medical services.
  • Medicare rebates do not, and were never intended to, cover the full cost of medical services.
  • Medical practitioners are able to set their own fees for their services.
  • The MBS fee and the Medicare rebate do not reflect the value of a medical service or an amount that medical practitioners should or must charge.’

The same applies to specialist medical fees, as consultations and procedures are covered by Medicare, not PHI. Again, where a gap exists, it must be filled by the patient.

Is PHI being unfairly blamed as the cause for all the gaps and out of pockets, when maybe Medicare was never meant to be as universal as we all wish it was?

I will revisit once all the invoices have arrived!

# with reference to Jenna Price SMH 19 July 2019

Should you go private?

The 44.5% of Australians who have private health insurance (PHI) for hospital treatment can choose to use that insurance to completely or partially fund their stay in a public or private hospital. 

When should a Medicare card holder, eligible for free treatment as a public patient in a public hospital, who also has PHI hospital membership, elect to use it?

Less than 10 % of the time appears to be what is acceptable to the healthcare system.

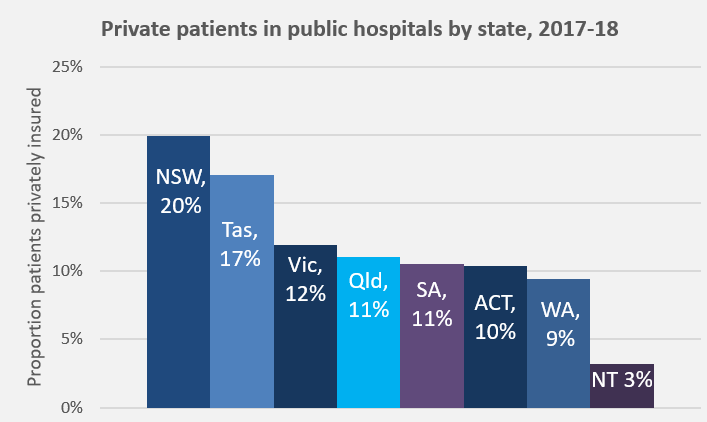
This figure is based on the status quo. In 2006-07, an average of 8.2 % of patients admitted to public hospitals used PHI (essentially rural/remote patients with limited choice and certain specialists who need to work in a public facility). As that figure has increased over time, reaching 13.5 % nationally in 2017-18, it has become a topic of concern, regularly debated and considered unsustainable#.

Unfortunately, individual patient needs do not really feature in the discussions. Analyses of which type of patients, procedures, and waiting times have contributed to the increase, and reporting of coercive techniques being used on patients to elect PHI, all point back to assumed financial benefit as the driver.
Public hospitals welcome private patients as they bring funds from an alternate source, and hence save money in their budgets. However, according to a 2018 Report by Martyn Goddard on Tasmanian public hospitals, ‘for each patient admitted as private, the public hospital loses an average of $1,800, compared with treating the same patient publicly‘. He notes that it is a myth that private patients contribute additional funds into public hospitals because the hospital only gets PHI payment for the treatment (that does not cover infrastructure, administration, catering etc. costs) and the Federal Government does not  fund these patients with the usual percent of the national efficient price, on the basis that it already pays for Medicare and the private insurance rebate. So the hospital gets only a fraction of the usual activity-based funding**.

Patients think they are doing the right thing by using their PHI and assisting the public system to free up resources to treat more public patients or conduct research. However, they actually open themselves up to additional costs via excess/co-payments and out-of-pockets from gap specialist charges.

Whatever the altruistic motivations of this cost-shifting to the private sector, it results in  upward pressure on insurance premiums. This then sets off a sequence of events to rival ‘Mouse Trap’, except everyone seems to get caught with the cheese at the end.  When PHI premiums go up, people drop their private health insurance. These people then rely on the public health system and the health insurance rebate age penalty actively works against them opting back into private insurance at a later date. 

The more privately insured people who use their cover in public hospitals, then the less beds are available for public patients and waiting times go up in the public hospital system producing a political issue for both State and Federal Governments. Some public patients are shunted to private facilities (this already happens at a pretty constant rate of 4% of separations per annum).

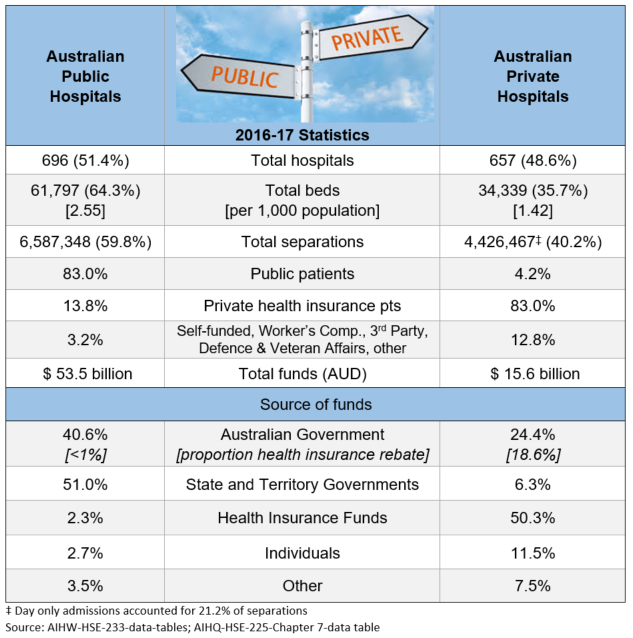
In reality, these are no true private hospitals, rather a symbiotic relationship exists between public and private across the Australian healthcare system. The table shows that PHI accounted for 50.3 % of private hospital funding in 2016-17. A further 30 % coming from Federal and State Governments, including Medicare payments for medical services and the private health insurance rebate.

**The National Health Reform Agreement requires IHPA to set the price for admitted private patients in public hospitals accounting for these payments by other parties, particularly private health insurers (for prostheses and the default bed day rate) and the Medicare Benefits Schedule (MBS). Documentation of revenue received for delivering care from sources other than through the (i.e. public patients in a public hospital) is not consistent and a correction factor has been introduced as an interim step.
Image source