Private Health Insurance in Australia
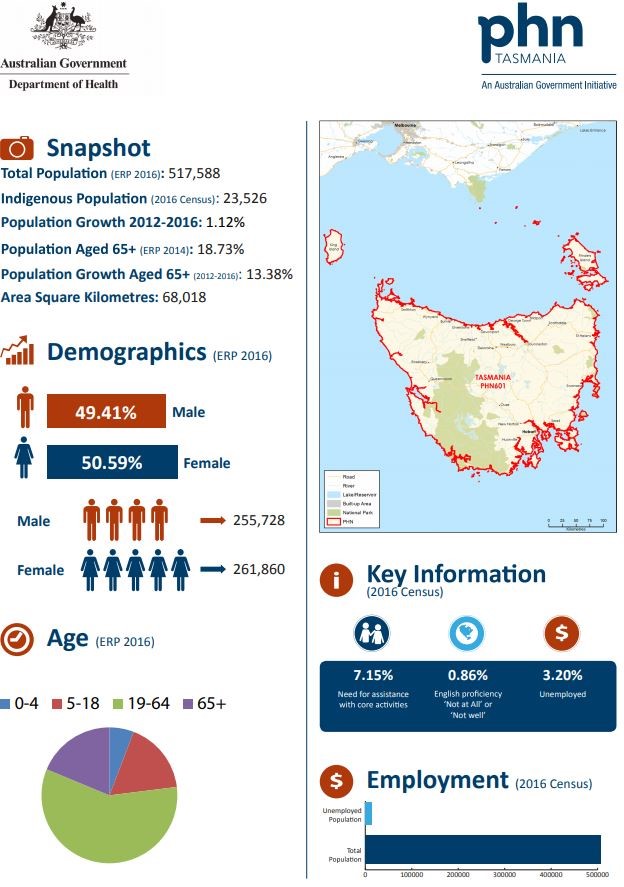
The foundations of the modern Australian Healthcare System are three publicly-financed programmes: Medicare, Pharmaceutical Benefits Scheme & Public Hospitals. However, private health services are an increasingly critical piece of the infrastructure, with approximately 40% of hospital admissions during 2016/17 occurring in the private system. Although not mandatory, such services can be funded through private health insurance (PHI).
The benefits of PHI include choice of doctor, assistance with the cost of treatment in a private hospital, and the cost of ancillary treatments not covered by Medicare such as dental, optical and physiotherapy. The median waiting time for elective surgery for privately insured patients has been reported to be approximately half that of public patients, at 20 and 42 days, respectively.
The PHI policies currently on offer contain a bewildering combination of benefits, co-payments, exclusions and restrictions depending upon the premium paid. Ambulance transport is usually covered, importantly as a trip may be free in some states/territories of Australia but only for ‘medically necessary’ journeys in others, or not at all.
A recent Choice review looked at free online insurance comparison websites purporting to assist consumers to select the most appropriate policy. They found that ‘free’ comparison sites may actually earn fees that make up a sizeable proportion of total premiums. Some sites only compared part of the market, while others were owned by the insurance companies they were comparing!
Membership woes
In June 1974, around the time of introduction of universal healthcare, a peak of 78.4% of the Australian population held private hospital insurance cover. At the end of June 2018, this figure was 45.1%, with 54.3% holding ancillary/extras or general cover (ambulance at a minimum). The policy trials and tribulations of maintaining private hospital cover levels are clearly shown in the graph.
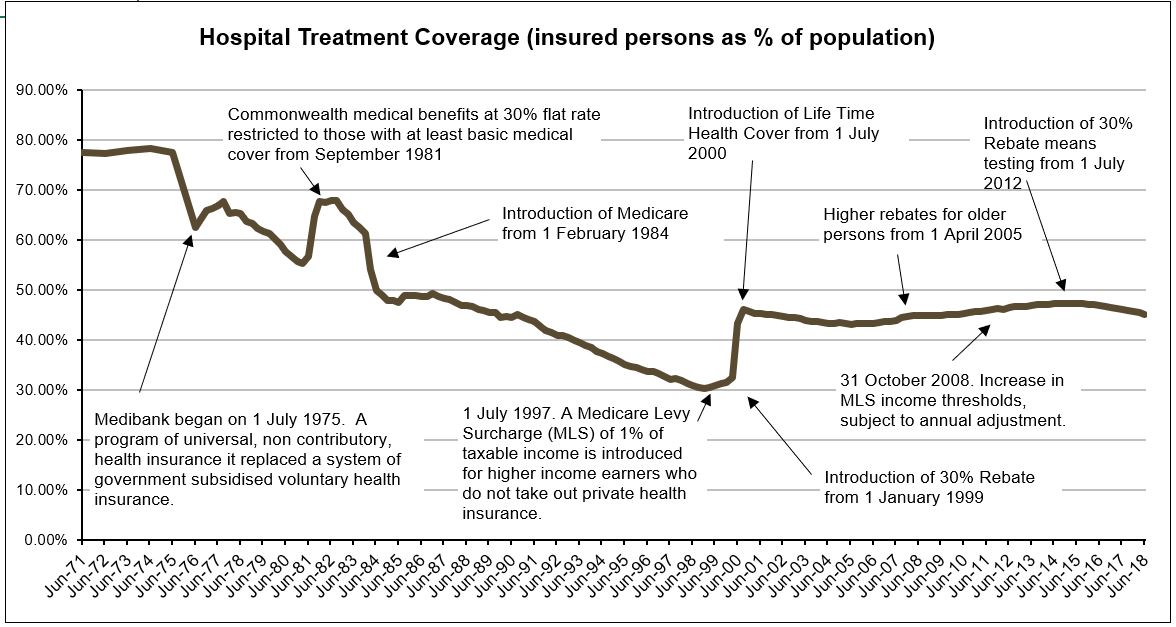
Source: APRA Quarterly PHI Statistics
The 2011 National Health Reform Agreement allowed patients with private hospital insurance entering a public hospital to choose whether to be admitted as a public or private patient. This led to an increase in the proportion of public hospital activity funded through private health insurance. Data shows that while 1 in 12 admissions to a public hospital in 2006–07 were under PHI, this figure increased to 1 in 7 during 2015–16 (AIHW 2017) suggesting that public hospitals were encouraging patients to use their private cover. Subsequently, negatively impacting the cost of PHI premiums and public hospital waiting lists.
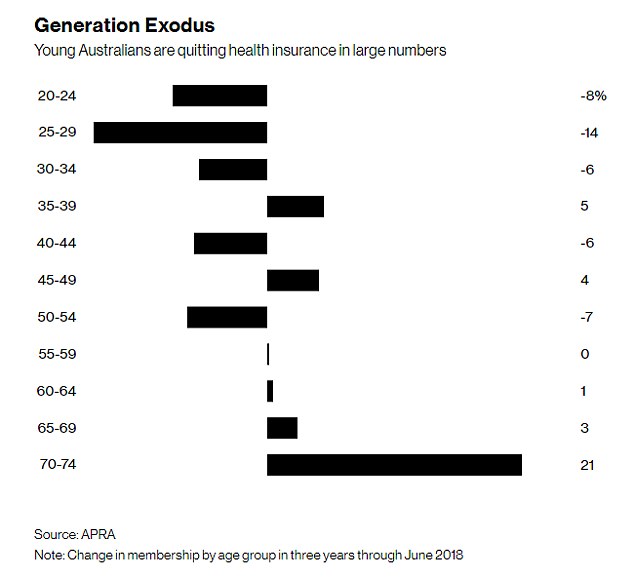
As policy holders uptake of medical services and the cost of treatments and procedures both rise, premium affordability is becoming an issue. The trend is away from PHI membership as premiums continue to increase year-on-year at twice the rate of inflation in an environment of low wage growth. Younger members, who are less likely to claim, are dropping cover (refer graph) leading to the question being asked: how can PHI funds be sustainable and afford to pay (ageing) members’ claims into the future?
Further Policy Reform
In October 2017, the Government announced a significant reform package, aimed at addressing some of the issues described. Successful implementation and adoption of these reforms will be essential to maintain the existing levels of service provided by the healthcare system.
For more detail, see the Parliamentary Library’s ‘Private Health Insurance: a quick guide’ by Amanda Biggs, Social Policy Section (Research Paper Series, 2017–18, 4 August 2017)
Meme source: King Julian Madagascar